

- The announcement of a temporary ceasefire between the United States and Iran led to the “dismantling of the fear trade.”
- The S&P 500 and Nasdaq Composite enjoyed a strong rebound, finishing in the green for seven straight trading sessions. History suggests that this momentum is expected to continue.
- The week ahead will be dominated by central bank activity, specifically comments from the Reserve Bank of New Zealand, employment data influencing the RBA’s decision, and the ECB’s balanced action on raising interest rates.
The trading week has been nothing short of a roller coaster, dominated by a major shift in geopolitical sentiment leading to volatility in energy and metals complexes. For most of the week, the primary narrative was “dismantling the fear trade” after the initial ceasefire between the US and Iran was announced.
Oil was the biggest victim of this appeasement rhetoric. Brent crude, which had been knocking on the door in triple digits amid threats to the Strait of Hormuz, fell as much as 15% midweek.
Gold also felt the pinch. After pausing at the $4,900 resistance level, the yellow metal saw the war premium erode, although it remains supported by the weakness of the US dollar. Speaking of the dollar, the DXY is currently hovering near the important “golden cross” support at 98.50.
CFDs on OAU shares on MT5
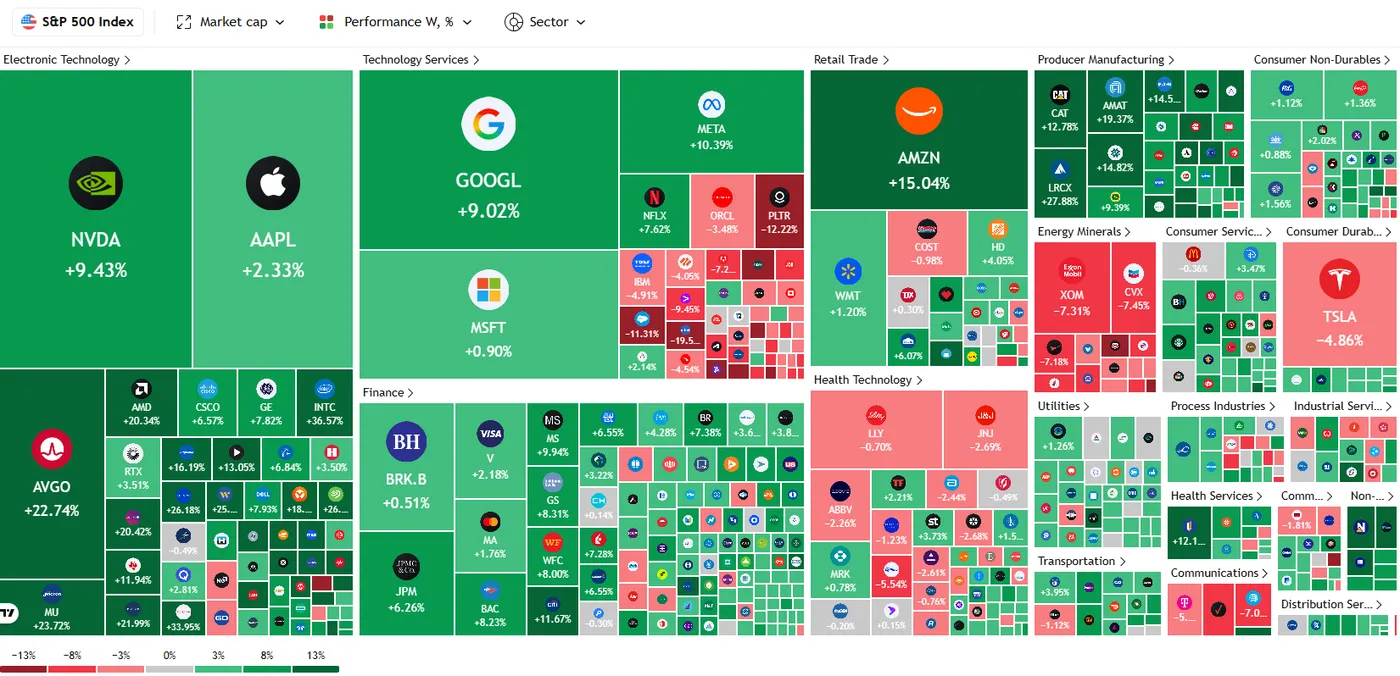
US stocks enjoyed a strong rebound following the ceasefire news. The S&P 500 closed in the green for 7 consecutive trading sessions, the longest streak since October 2025. The index rose 7.6% during this period, recovering almost the entirety of the wartime decline.
The Nasdaq Composite Index also posted a similar 7-day stretch, the longest since August 2025.
Source: Trading View
Since the 1950s, the market has seen a similar streak with gains of +7.0% at least 9 other times, according to Carson Investment Research.
The S&P 500 then rose in 8 of those instances over the next month, with an average return of +4.4%.
Over the next 3 months, the market rose 7 times and gained +10.2% on average.
History suggests that market momentum is set to continue.
This came despite US inflation data rising by 0.9% compared to the previous month, with headline inflation rising to its highest levels in two years. Inflation data was the headline data released this week and was largely in line with estimates leaving markets focused on the geopolitical narrative as the week came to a close.
Heading into the weekend, markets appear somewhat optimistic as the US and Iran prepare for talks in Pakistan scheduled to begin on Saturday. The talks are likely to have a huge impact on whether markets start the new week risk-off or risk-on.
Next week: Central banks in the crosshairs
Here’s a summary of what I’ll be watching next week in Asia, the US, the Eurozone and the UK, anticipating a quiet week from an economic data perspective.
China and Japan: Asia’s resilience?
In China, market participants will monitor trade data and liquidity injections from the People’s Bank of China. As concerns about global growth persist, any sign of domestic stimulus will be welcomed by stock bulls. In Japan, the Nikkei 225 is still on a knife’s edge. We are watching the 50-day EMA closely; A sustained break below this level could confirm conditions for a bearish breakdown, especially if the safe-haven Japanese yen continues to strengthen.
Australia and New Zealand: Focus on the Reserve Bank of Australia and the Reserve Bank of New Zealand
NZD/USD is currently testing a key support level at 0.5700. RBNZ’s upcoming comment will be pivotal; A cautious bias here could lead to a decline in the New Zealand dollar. Across the Tasman, Australian employment data will provide the Reserve Bank of Australia with ammunition to decide whether it can pause or whether the inflationary effects from energy costs require another hike.
Europe and the United Kingdom: the ECB’s balancing act
Despite the ceasefire, European stocks remained cautious. The ECB still plans to raise interest rates twice, driven by the delayed impact of energy prices on core inflation. We’ll be watching the Euro (EUR/USD) to see if it can benefit from a potential dollar slowdown or if sluggish growth expectations in the Eurozone prevent any upsides.
United States: Focus on geopolitics as data remains weak
A very quiet week in the US, with the Fed’s Beige Book the highlight of the week. Markets will likely be more preoccupied with the developments that occurred during the weekend talks with Iran and how that could shape the markets and the US dollar next week.
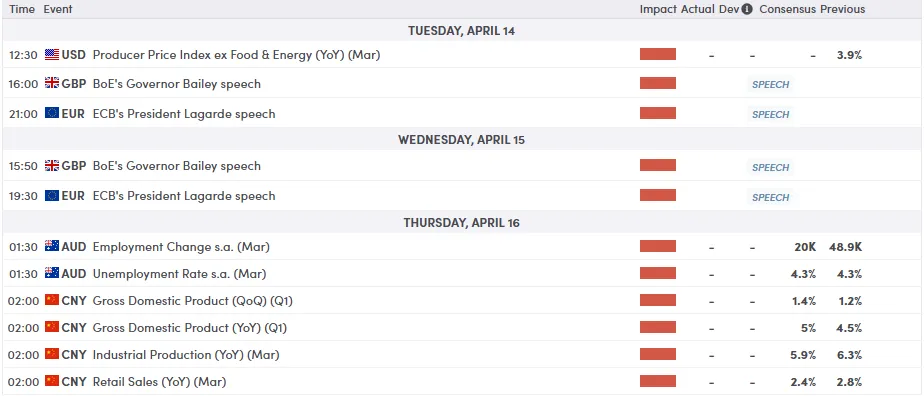
To see all the economic releases and events affecting the market, see the MarketPulse Economic Calendar. (Click to enlarge)
Chart of the week – Nasdaq 100
Technically, the Nasdaq 100 (US100) is currently showing a strong bullish reversal after finding significant support near the 22,800 handle in late March.
The index made an impressive break above the downtrend line that has restricted price action since the February highs, signaling a shift in momentum.
A breakout of the trend line (channel) sets the indicator up for a potential move of 2,000 odd pips to the upside, around the 26,500 handle.
Currently, the price is grappling with the 100-day simple moving average (red line) at 25,013, which coincides with a structural resistance level. A daily close above this area would pave the way for a retest of the 25320 horizontal barrier.
The Relative Strength Index (14) is trending higher at 60.9, indicating that there is still room for further gains before reaching the overbought zone.
However, traders should watch for possible pullbacks towards the 200-day simple moving average (yellow line) at 24568, which is now acting as a key dynamic support. Failure to hold above this level would negate the recent breakout.
Nasdaq 100 daily chart, April 10, 2025
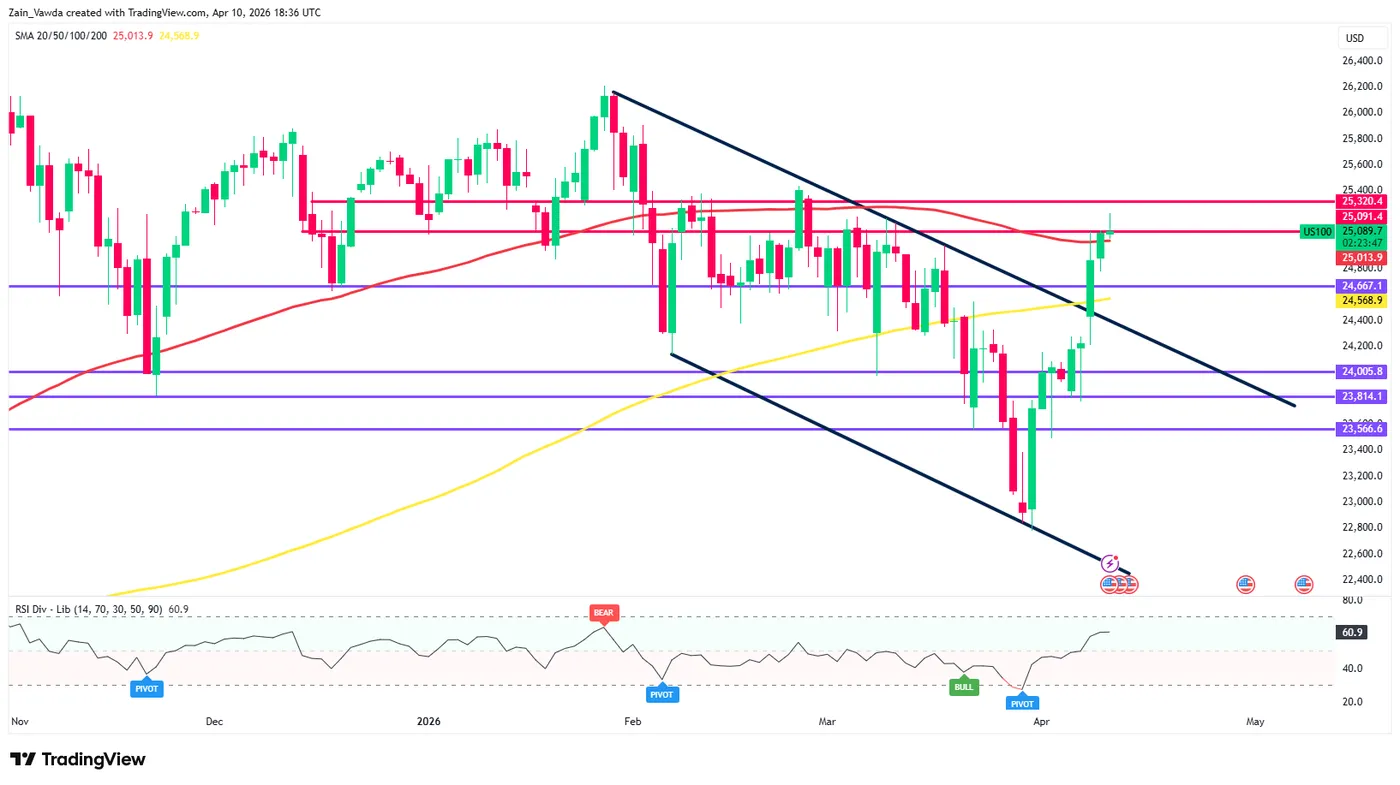
Source: TradingView.Com (click to enlarge)


