

Bitcoin price started a new decline from the $73,800 area. BTC is consolidating and may face difficulty staying above the $70,500 support level.
- Bitcoin failed to stay above $72,500 and corrected gains.
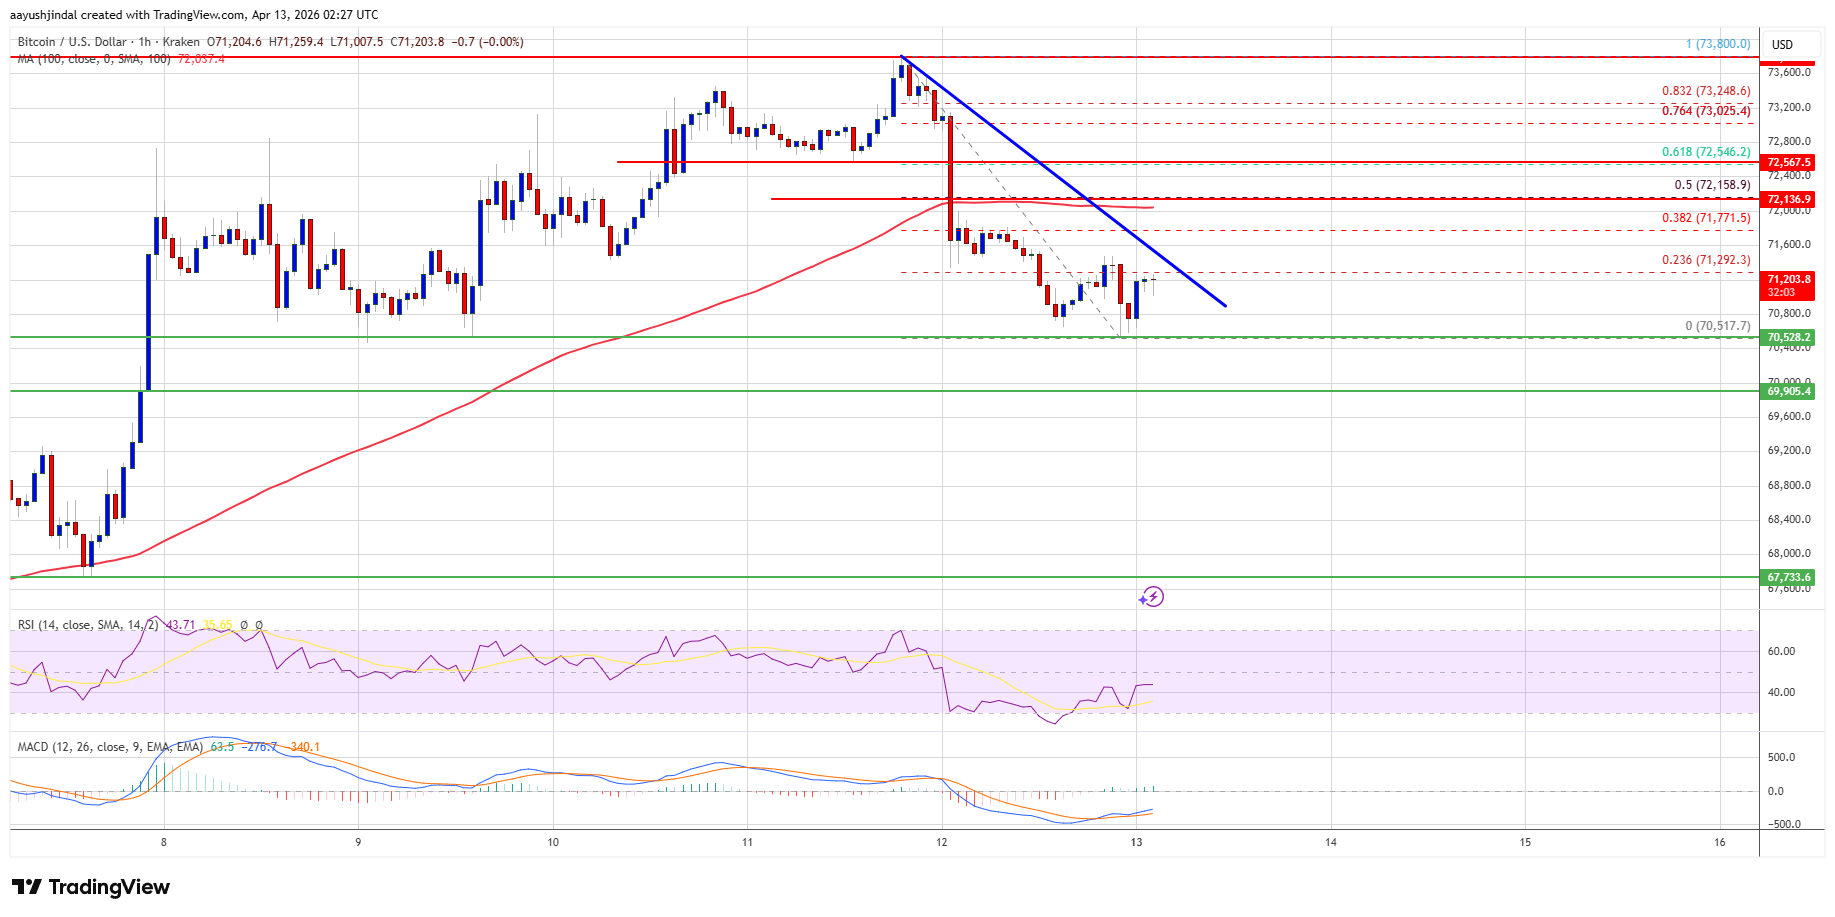
- The price is trading below $72,000 and the 100 hourly simple moving average.
- There is a solid bearish trend line forming with resistance at $71,450 on the hourly chart of the BTC/USD pair (data feed from Kraken).
- The pair may extend losses if it remains below the $71,500 and $72,000 levels.
Bitcoin price fell again
Bitcoin price failed to stay above $72,500 resistance area. BTC formed a top near $73,800 and started a new decline. There was a move below the $72,500 level.
The price fell below the $71,500 and $71,200 levels. A bottom was formed at $70,517, and the price is now consolidating losses below the 23.6% Fib retracement level of the downward move from the $73,800 swing high to the $70,517 low.
Bitcoin is now trading at just under $72,000 100 hourly simple moving average. If the price remains stable above $70,500, it may attempt a new increase. Immediate resistance is located near the $71,500 level. There is also a solid downtrend line forming with resistance at $71,450 on the hourly chart of the BTC/USD pair.
The first major resistance is near the $72,000 level. A close above the $72,000 resistance could push the price higher. In the mentioned case, the price may rise and test the $72,500 resistance level. Any further gains may push the price towards the $73,200 level. The next barrier for the bulls could be $74,000.
Continued downside in BTC?
If Bitcoin fails to rise above the $72,000 resistance area, it could start another decline. Immediate support is located near the $70,800 level.
The first major support is near the $70,500 level. The next support is now near the $70,000 area. Any further losses could send the price towards the $69,200 support level in the near term. Key support now lies at $68,800, below which BTC may have difficulty recovering in the near term.
Technical indicators:
Hourly MACD – The MACD is now gaining pace in the bearish zone.
Hourly RSI (Relative Strength Index) – The RSI for BTC/USD is now below the 50 level.
Key Support Levels – $70,500, followed by $70,000.
Key resistance levels – $71,500 and $72,000.


