
Solana started a new rally above the $85 area. SOL price is now consolidating near $87 and may aim for further gains above the $90 area.
- SOL price started a new upward movement above the $82 and $85 levels against the US Dollar.
- The price is now trading above the $85 level and the 100 hourly simple moving average.
- There was a break above the downtrend line with resistance at $83.60 on the hourly chart of the SOL/USD pair (data source from Kraken).
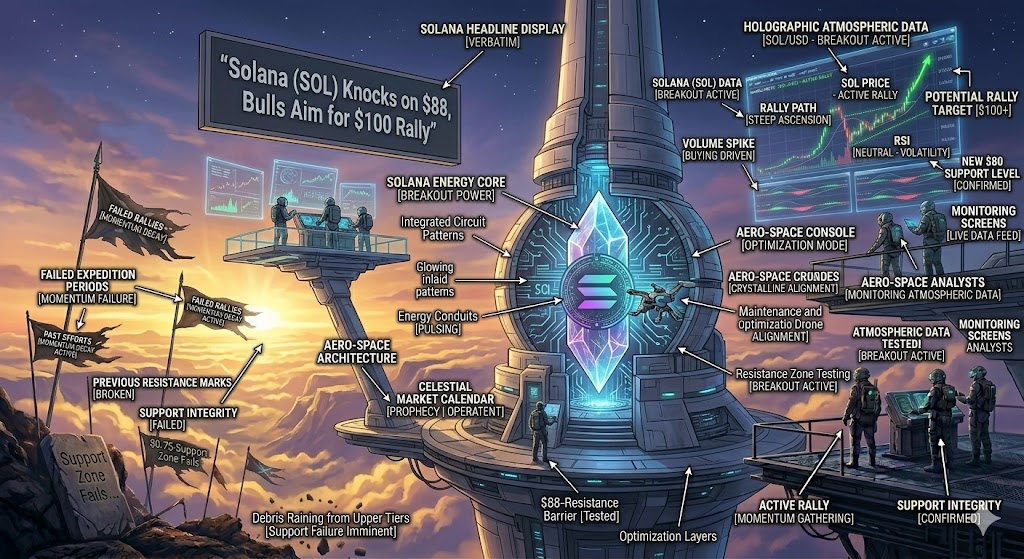
- The pair may continue its gains if it exceeds the $88 resistance area.
Solana price begins a new recovery wave
Solana price started to rise nicely after settling above the $82 area Bitcoin and Ethereum. SOL rose above the $85 level to enter a short-term positive zone.
Earlier, there was a break above the downtrend line with resistance at $83.60 on the hourly chart of the SOL/USD pair. The price even broke the $86 resistance level. A top was formed at $86.85, and the price is now consolidating gains above the 23.6% Fib retracement level of the recent upward move from the swing low of $81.32 to the swing high of $86.85.
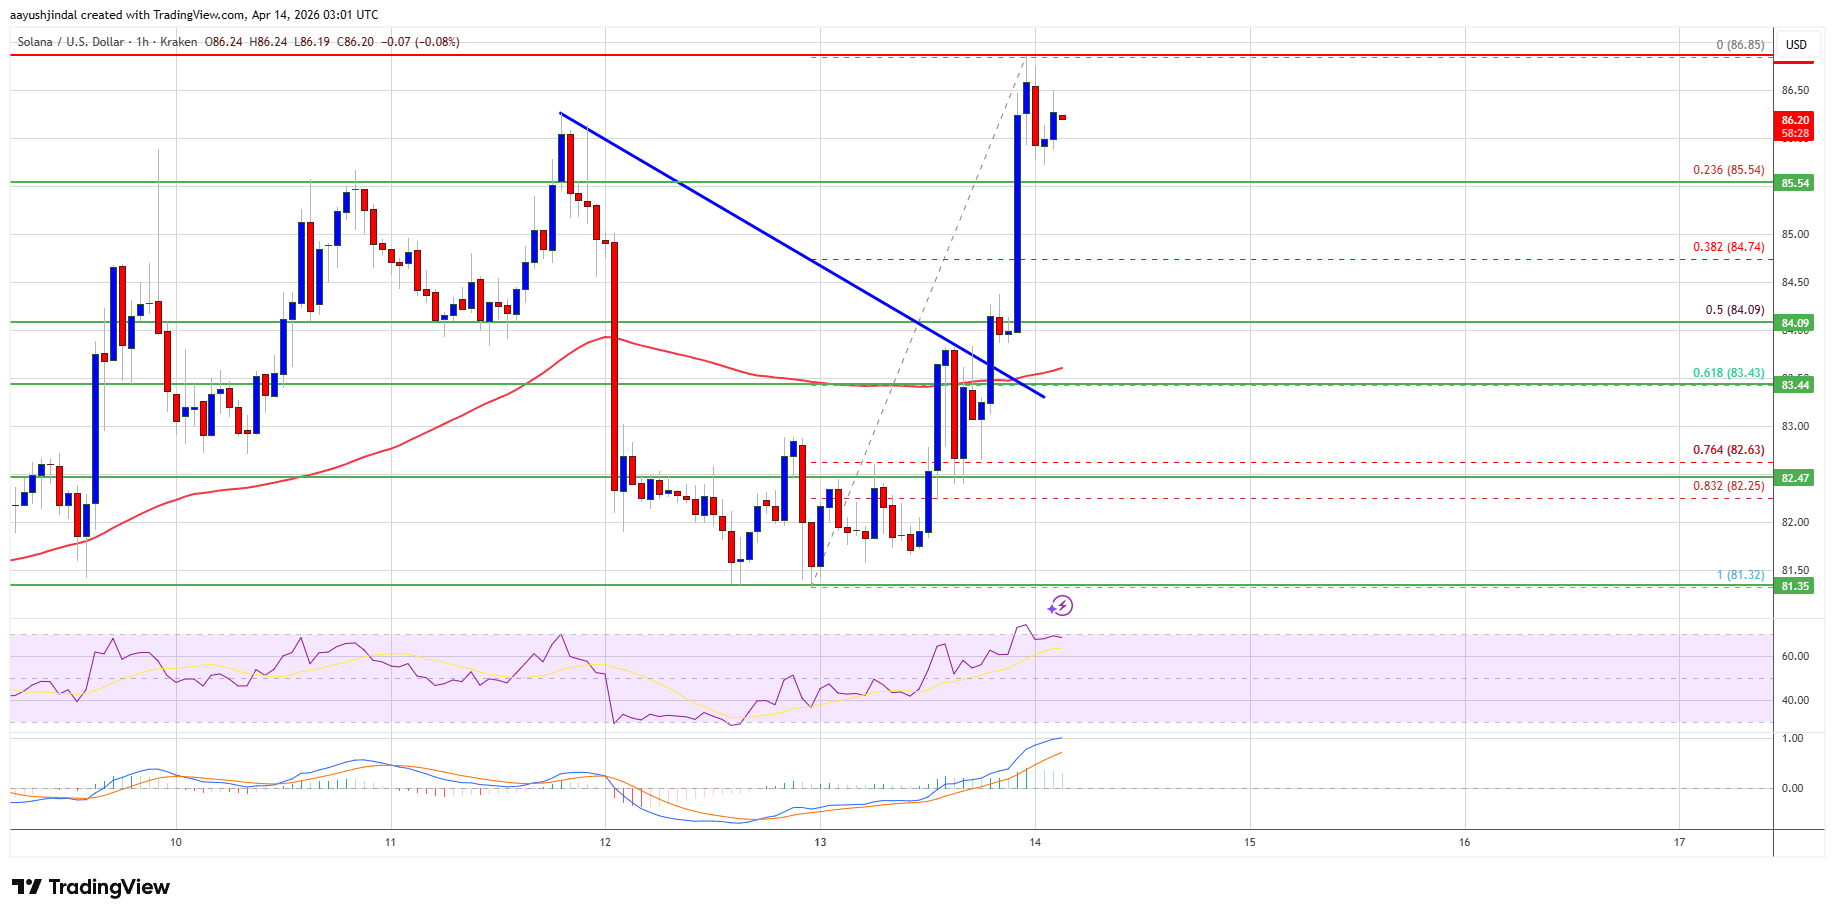
Solana is now trading above the $85 level and the 100 hourly simple moving average. On the upside, the price is facing resistance near the $86.80 level. The next major resistance is near the $88 level. The main resistance could be at $92. A successful close above the $92 resistance area could pave the way for another steady increase. The next major resistance is $100. Any further gains could send the price towards the $102 level.
Correcting downside in SOL?
If SOL fails to rise above the $88 resistance level, it could start another decline. Initial support on the downside is near the $85.50 area. The first major support is near the $84.00 level and the 50% Fib retracement level of the recent upward move from the $81.32 swing low to the $86.85 swing high.
A break below the $84.00 level could send the price towards the $82 support area. If there is a close below the $82 support level, the price could fall towards the $76.50 support level in the near term.
Technical indicators
Hourly MACD – The MACD for SOL/USD is gaining pace in the bullish zone.
Hourly RSI (Relative Strength Index) – The RSI for SOL/USD is above the 50 level.
Key Support Levels – $85.50 and $84.00
Major resistance levels – $88.00 and $90.00.


