

- Mid-Week Review where we dive into key developments for the North American and global markets
- Markets take a breather before US-Iran talks resume tomorrow, with mediators pushing for a ceasefire extension
- Stock markets are on track to recover to all-time highs with cheerful markets
Log in to our mid-week North American Markets Overview, where we examine current topics in North America and provide an overview of index and currency performance.
Markets continue their euphoric rally as both sides are said to be keen to continue talks.
Traders already seem to have a sixth sense for turning points in the narrative, as stock market buyers mercilessly bid up prices to return to pre-war highs.
Careful analysis would warn of the possibility of euphoric behavior, especially given that a peace agreement has not yet been properly concluded.
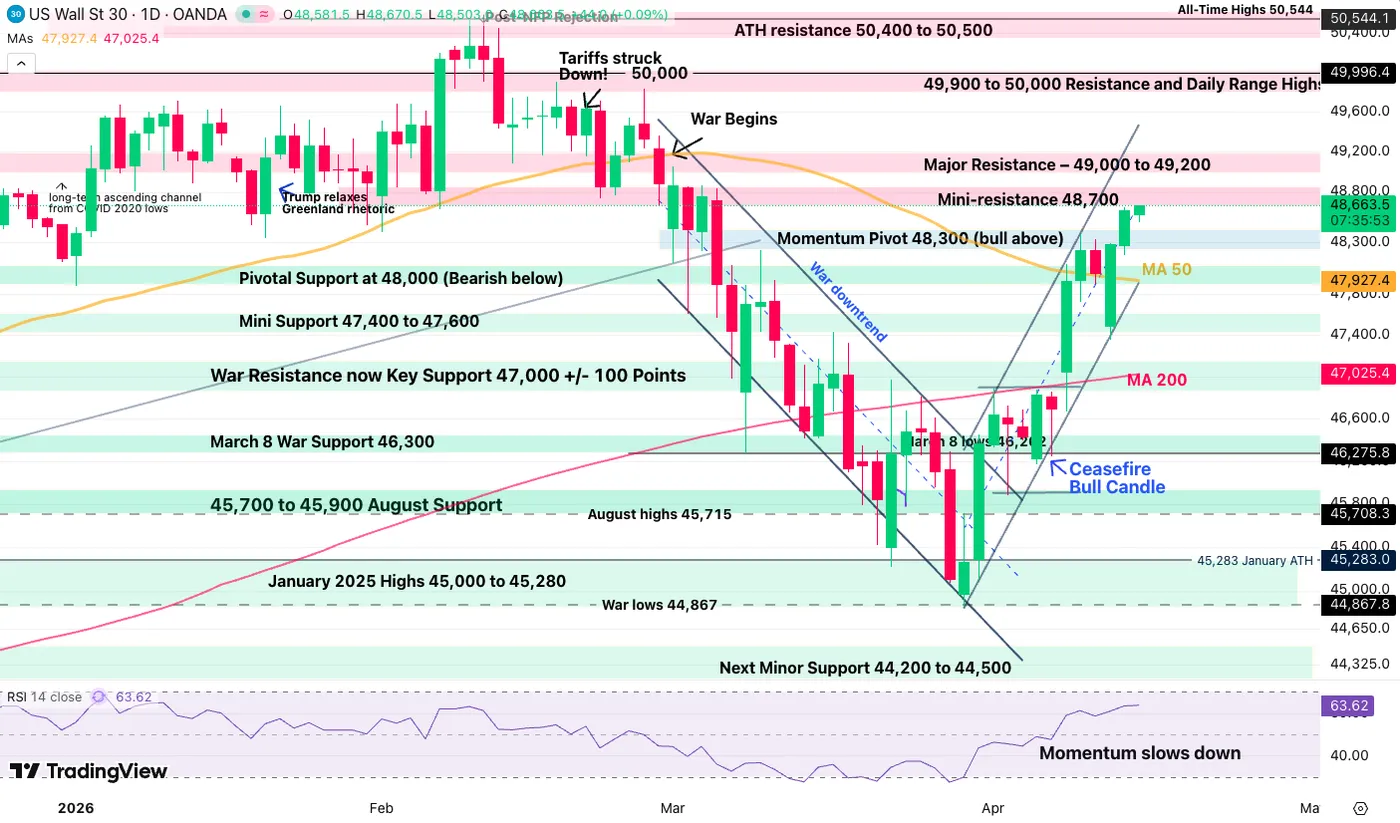
Dow Jones daily chart. April 15, 2026 – Source: TradingView
After a chaotic first round of negotiations over the weekend, concern grew, but that did not last long, as President Trump repeatedly reassured that “(Iran) sent the right people and they want to make a deal.” The nuclear issue, a subject of particular contention, is now on the table for the next resumption of discussions on Thursday.
On the other hand, with the holding of official talks between Israel and Lebanon – the first since 1993 – peace in the Middle East seems closer day by day.
The reality could be a bit messier than participants priced it out, but all they wanted to see was a war that didn’t escalate further (and with fears of a ground operation just three weeks ago, that’s pretty decent progress).
The latest news from the Associated Press reported that the mediators are now looking to extend the ceasefire, which is scheduled to expire next Tuesday, April 22.
Moreover, even energy commodity traders are now trying to turn the page on this heavy chapter, with the escalation premium now completely erased.
As a result, only a $20 supply dry premium remains, which should not be erased unless an agreement is reached.
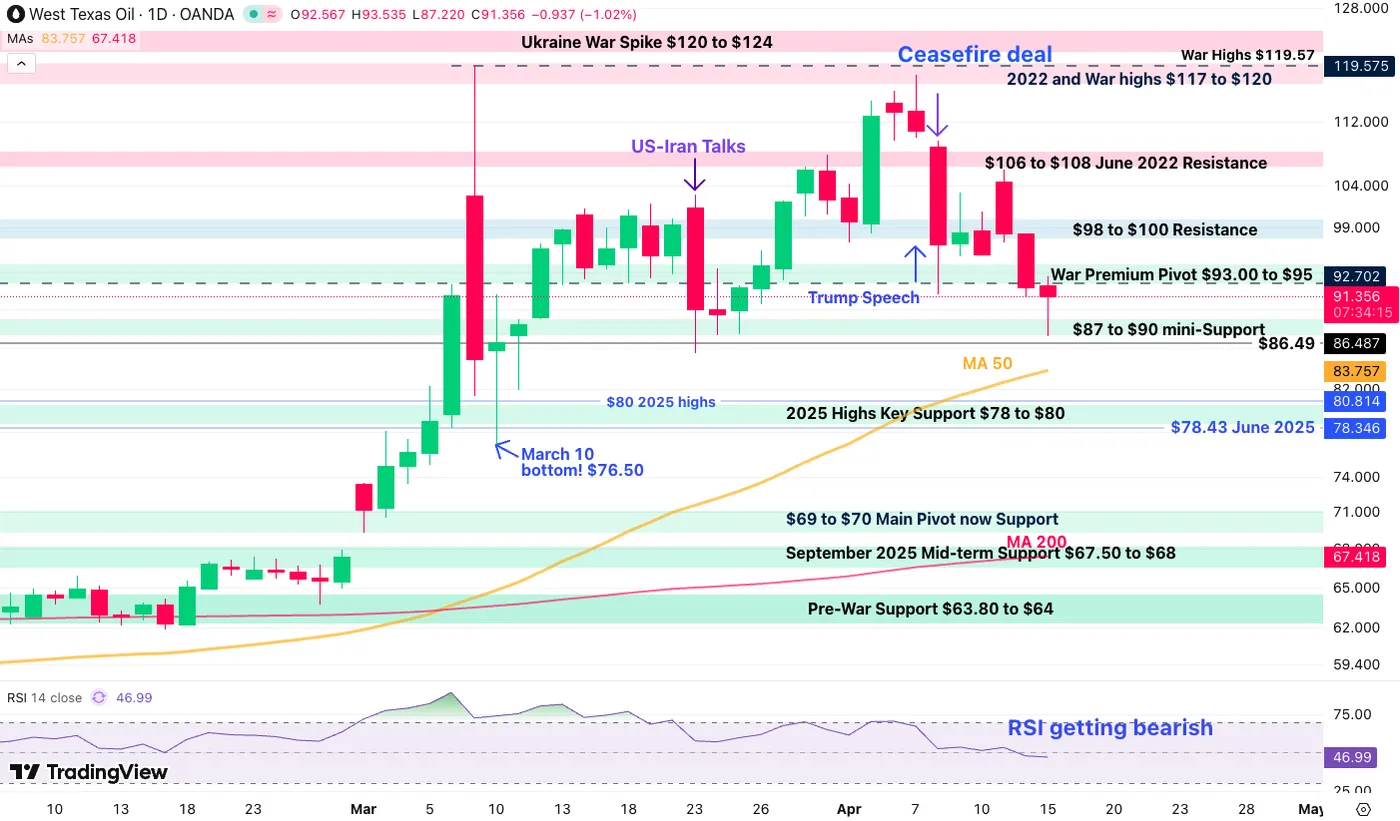
Daily oil chart. April 15, 2026 – Source: TradingView
On the macroeconomic side, the US announced a less hot than expected Producer Price Index report, which began to show a shift in demand-side inflation, with only supply and energy-related inflation hurting the outlook.
After all, the IEEPA tariffs were blocked by the US Supreme Court, which quickly deleted a few percentage points from the data – and the worst aspect of this is the fact that oil-induced inflation can impact inflation in a 3-6 month period as companies initially absorb the lower margins before passing them on to consumers (when considering previous energy crises).
And on the northern border, Canada just reported a significant rebound in manufacturing sales, up 3.6% (slightly below estimates of 3.8%), erasing the -3% loss from January.
This continues to show how the North American economies have developed sideways recently, with employment in both the US and Canada constantly fluctuating and economic indicators slowing and picking up again.
Policymakers will certainly wait to see the effects of the war on consumption and inflation before moving the needle.
Kevin Warsh’s hearing is now expected to take place next week, after being postponed due to Jerome Powell’s court case – and Trump had some words about the issue this morning (and as usual, they couldn’t have been sweeter).
Let’s dive into our mid-week North American markets summary.
Performance of North American indices
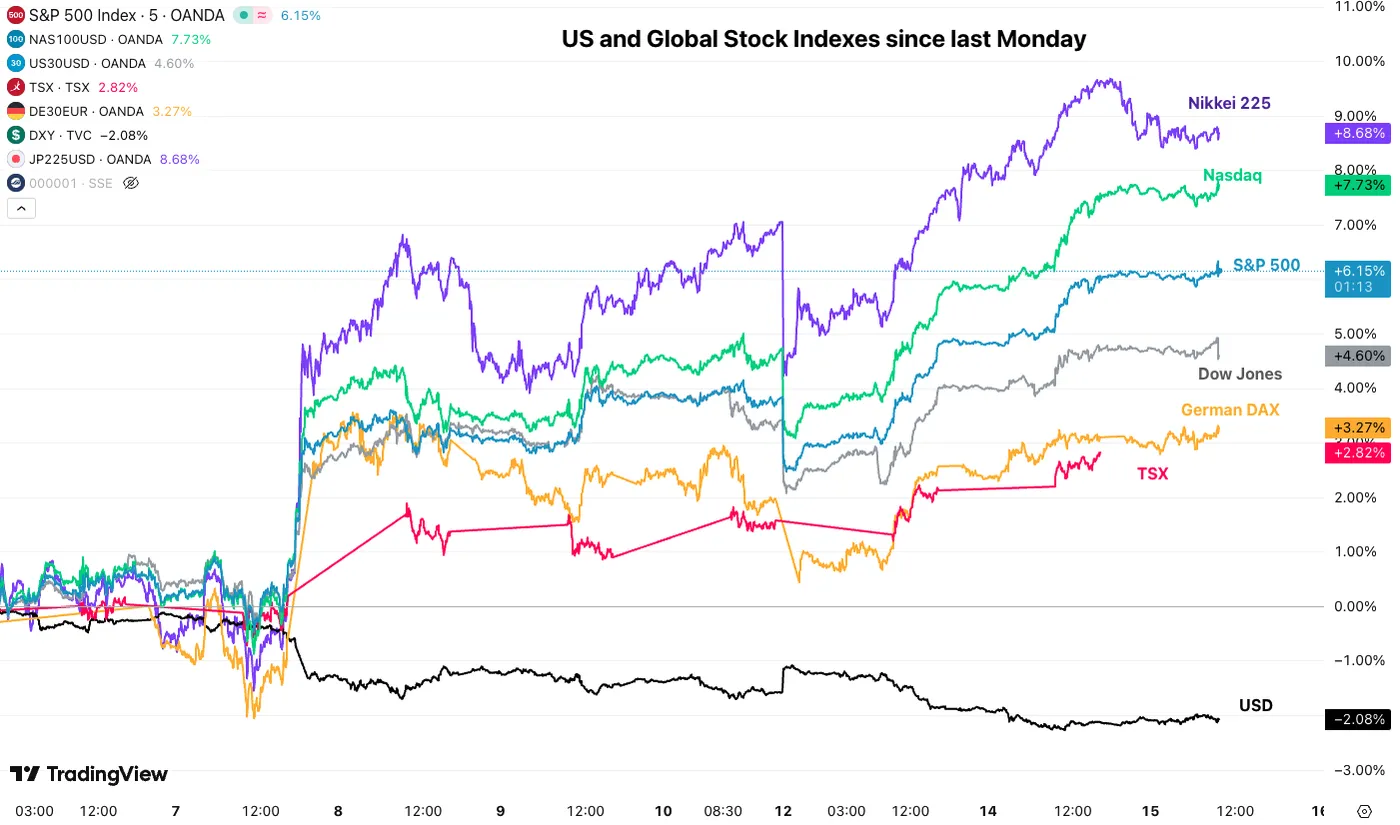
Highest performing North American indices since last Monday – April 15, 2026 – Source: TradingView
Global stocks continue their dramatic recovery, largely led by Japanese and US stocks (with the US dollar and Japanese yen also weakening strongly to add fuel to their markets).
4-hour dollar index chart
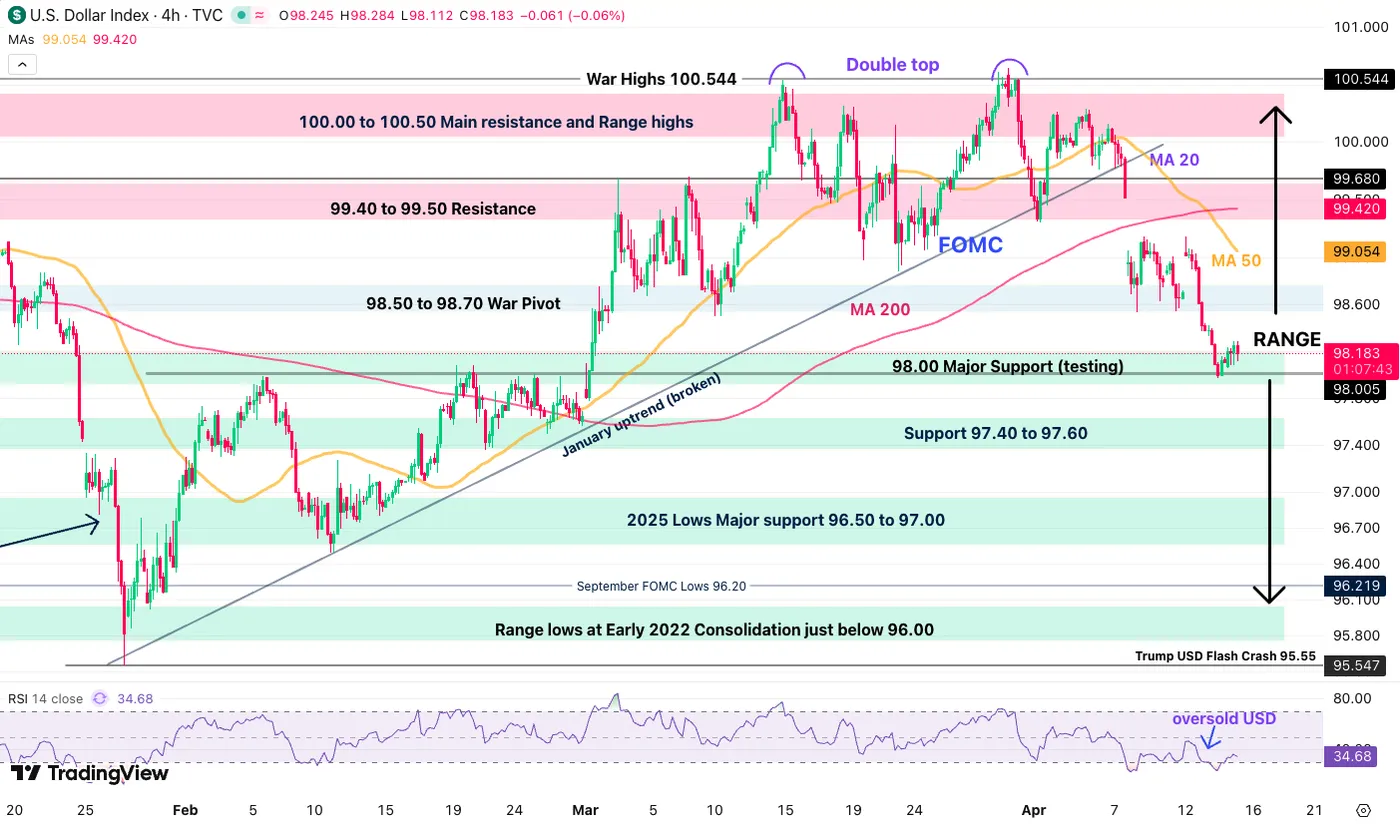
Four-hour dollar index chart, April 15, 2026 – Source: TradingView
The dollar index continues its long-term range-bound trajectory, rejecting the 100.00 resistance level for the fourth time since July 2025 and now finding intermediate support at the key 98.00 level.
Traders are waiting to hear more from the ongoing negotiations before making their next moves – to prepare for the next stage for the US dollar, I invite you to check out our latest analysis of the forex market.
Levels to place on your DXY charts:
Resistance levels
- 98.50 to 98.70 Axis of War
- Resistance 99.40 to 99.50
- From 100.00 to 100.50, the main resistance and highs of the range
- War highs 100.544 (double top)
Support levels
- 98.00 Main Support (Testing)
- Support 97.40 to 97.60
- 2025 lows. Main support from 96.50 to 97.00
Mid-week performance of the US dollar against major currencies
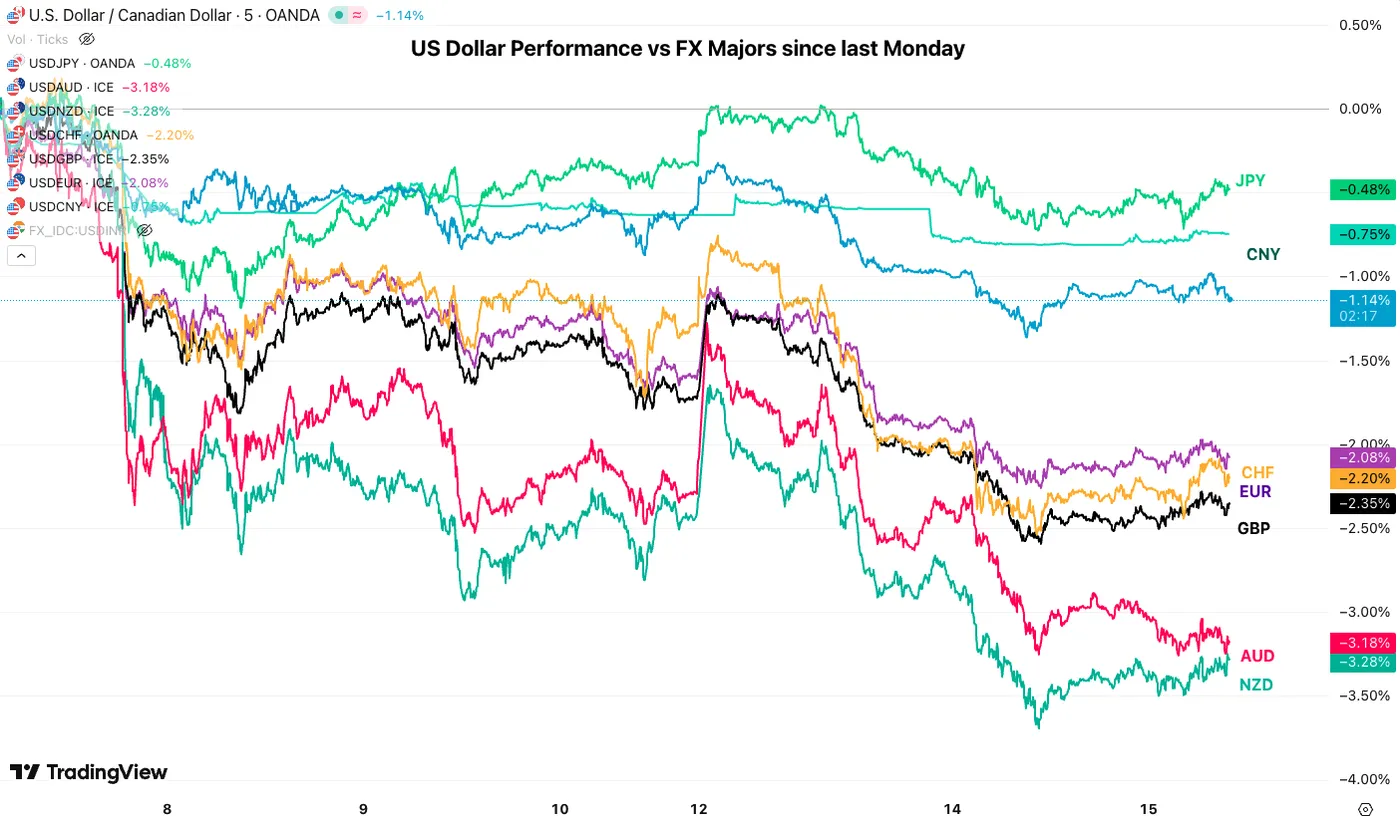
The US dollar against other major currencies since last Monday, April 15, 2026 – Source: TradingView
The US dollar fell against most major currencies last week, most notably against the Australian dollar and the New Zealand dollar – both relieved by lower tensions and less escalating concerns over energy supplies.
The regional trends in the FX market seen in 2025 continue again, which also allowed the EU basket of currencies to continue to outperform the US dollar (~+2%).
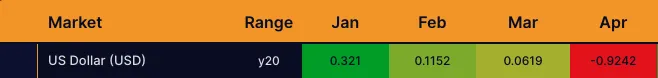
Seasonal performance of the US dollar throughout the first quarter – Source: Market-Bulls.com
For those who didn’t watch last week’s edition, here is the seasonal performance chart for the US Dollar. April is the weakest month of the year, so this may impact the dollar more.
The next step will be conditional on adequate progress in the talks between the United States and Iran.
Mid-week performance of the Canadian dollar against major currencies
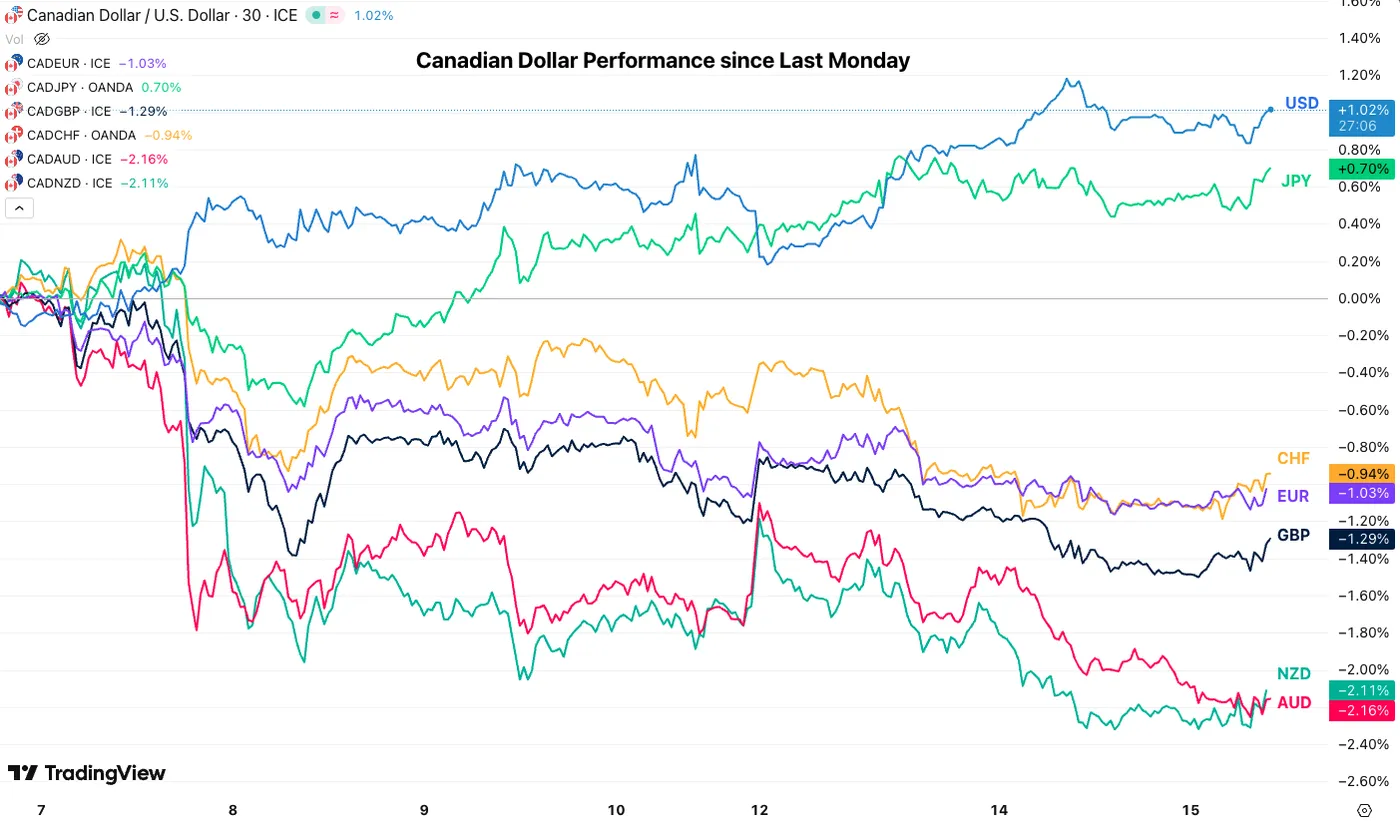
Canadian dollar versus other major currencies, April 15, 2026 – Source: TradingView.
The Canadian dollar has once again given up a fair portion of its advance against major currencies but this effect is much less exaggerated than what was observed in the US dollar.
The Canadian dollar is actually trying to rebound from recent lows against its peers, supported by better manufacturing data and an expanding order book for gasoline exports.
Keep a close eye on the Canadian dollar next week.
Intraday technical levels for the USD/CAD pair
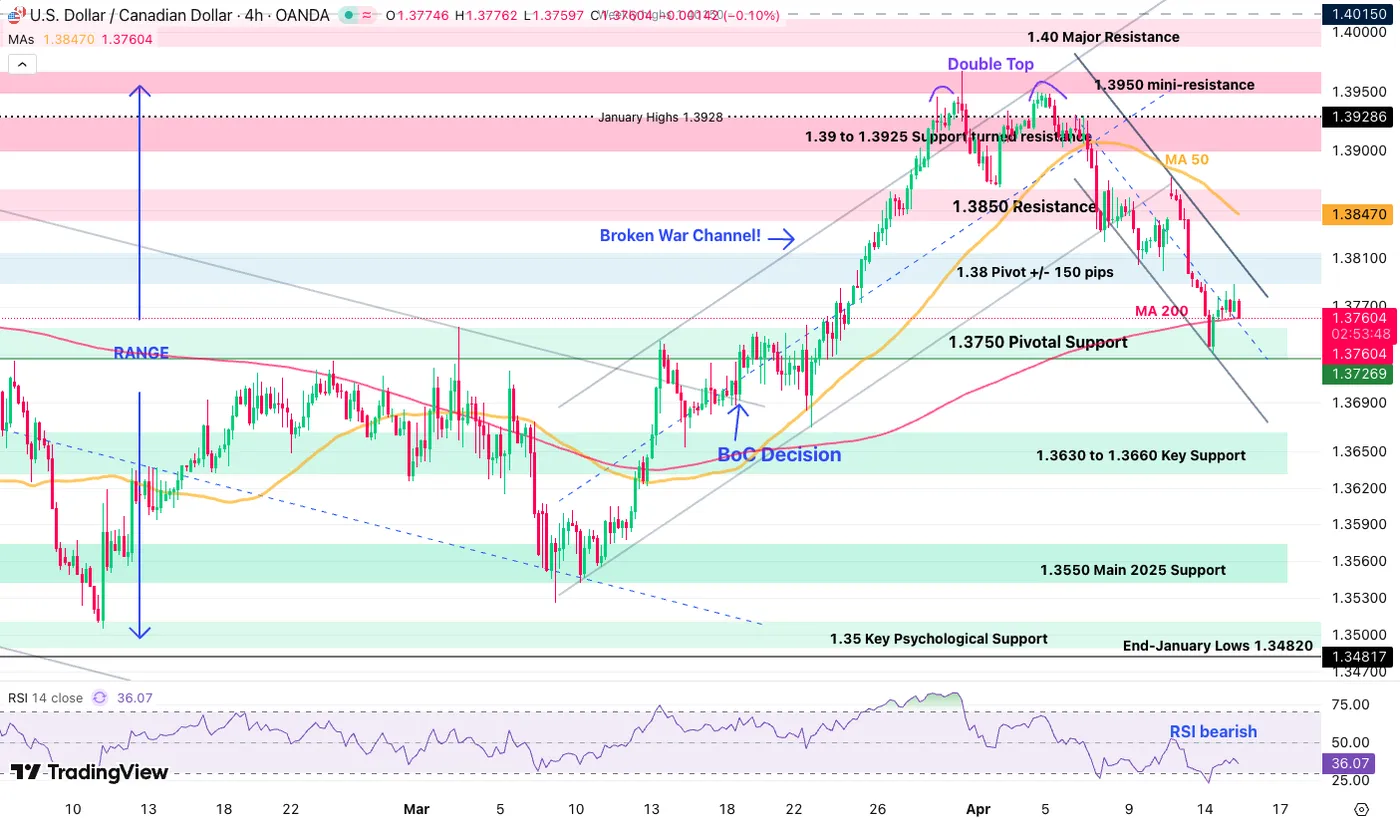
USD/CAD 4-hour chart, April 15, 2026 – Source: TradingView
The USD/CAD pair continues to correct within its large range, after breaking the main momentum at the 1.38 pivot.
With the development now within a medium downtrend channel, traders will be looking to the key support level at 1.3750 to see if it will hold or break.
Interest levels for USD/CAD trading
Resistance levels
- 1.38 axis +/- 150 points
- Resistance 1.3850
- Support from 1.39 to 1.3925 turned into resistance
- 1.3950 highest levels
Support levels
- 1.3750 pivotal support
- 1.3630 to 1.3660 major support
- 1.3550 main support 2025
- 1.35 Basic psychological support
Economic calendar for the United States and Canada until next Wednesday
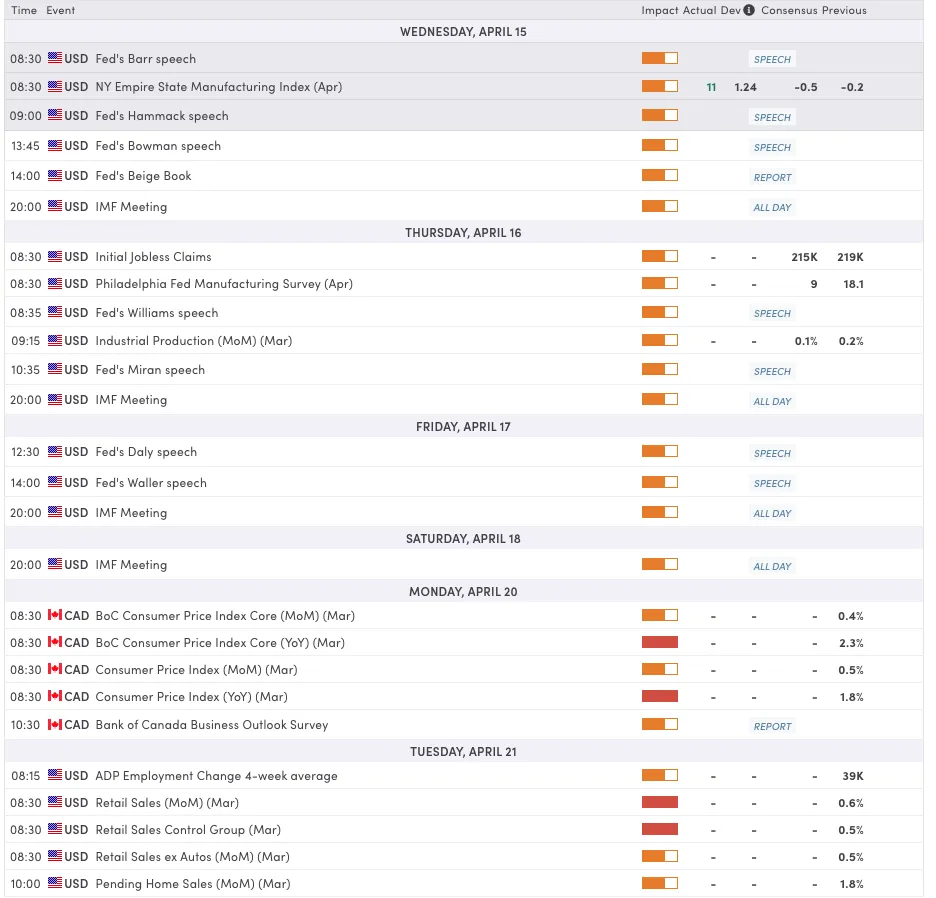
US and Canadian data towards next Wednesday, MarketPulse economic calendar
The North American calendar is somewhat quieter until next Wednesday. The Canadian dollar will face an important test on Monday with the release of the California inflation report at 8:30 am
As developments in the Middle East decline, keep a close eye on the ceasefire and oil news!
Safe deals!


