

- Gold’s outlook remains slightly sour after falling 4% in one session amid profit-taking.
- Structural gold demand remains healthy, with institutional targets set at $6,200 by mid-2026.
- Gold’s path could be bumpy depending on US macroeconomic data releases.
Gold is witnessing increasing volatility after breaking the $5,500 barrier. The metal posted a 20% gain in January, its strongest monthly performance since 1980, driven by geopolitical frictions and new US trade tariffs. However, this parabolic rally ran into immediate resistance, triggering a sharp correction that sent spot prices down more than 4% in a single session amid profit-taking.
–Are you interested in learning more about ETF brokers? Check out our detailed guide-
The immediate focus for traders is the sustainability of the current bottom. The decline was exacerbated by the recovery of the US dollar, which put pressure on the precious metal. Despite the shakeout, the fundamental drivers of a bull market continuation remain intact. Institutional analysis points to continued central bank accumulation and demand for “stateless” assets as key factors that will limit downside risks in the medium term.
Looking to the future, expectations are trending strongly upward. UBS has revised its forecasts, and now expects gold prices to reach $6,200 by mid-2026. This bullish theory is based on the expectation that real interest rates will eventually moderate and that geopolitical risk premiums will become a permanent fixture in asset pricing.
However, the path to $6,000 is fraught with event risks. Fed policy remains a major headwind. If US economic data remains strong and forces the Fed to maintain its “higher for longer” stance, the opportunity cost of holding non-yielding bullion could limit gains.
On the other hand, any worsening of conflicts in the Middle East or confirmation of new tariffs will likely push the next phase higher. Before the next big move in the market, it is now preparing for a period of consolidation.
Going forward, market participants will remain focused on the US Producer Price Index to find new momentum, as Fed Chair Powell reiterated the data-driven approach in the recent press conference, making major releases all the more necessary.
Technical Outlook for Gold: Bulls are weak below the 20-MA
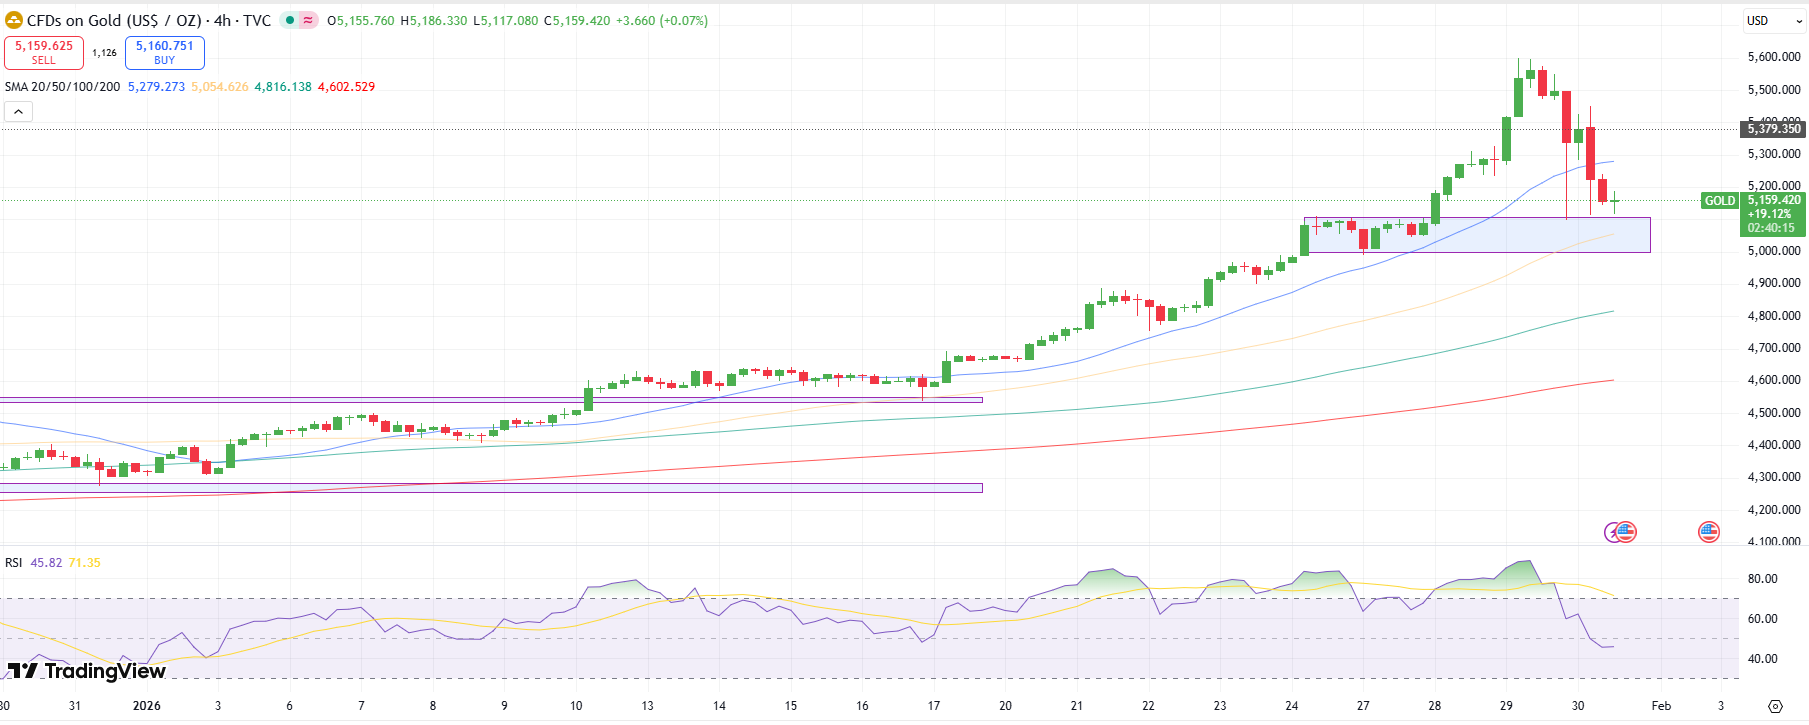
Gold’s 4-hour chart shows a strong demand zone near $5,100, tested twice over the last 4 candles. However, the price fell below the 20-period moving average, indicating strong selling pressure. If the area fails to hold sellers, the price may test the $5,000 psychological level before the 100 and 200 period moving averages at $4,820 and $4,600, respectively.
–Are you interested in learning more about Forex brokers in south africa? Check out our detailed guide-
However, the RSI, which fell below 50.0, is now flat, indicating potential consolidation before any decisive move. In case of bullish momentum, the yellow metal could test the 20-period moving average at $5,280, then $5,400, then $5,600.
Are you looking to trade Forex now? Invest in eToro!
68% of retail investor accounts lose money when trading CFDs with this provider. You should consider whether you can afford to take the high risk of losing your money.


