

The US dollar has made a very sharp correction since the two-week ceasefire was announced, and not without good reason.
The notorious petrodollar trade has dominated financial markets from all sides since the beginning of the US-Iran-Israel conflict, especially amid crude oil prices rising to their highest levels in 4 years.
The US dollar has historically had a good relationship with black gold, but the recent panic during the conflict has re-strengthened the ties between the two financial assets, rowing the same boat.
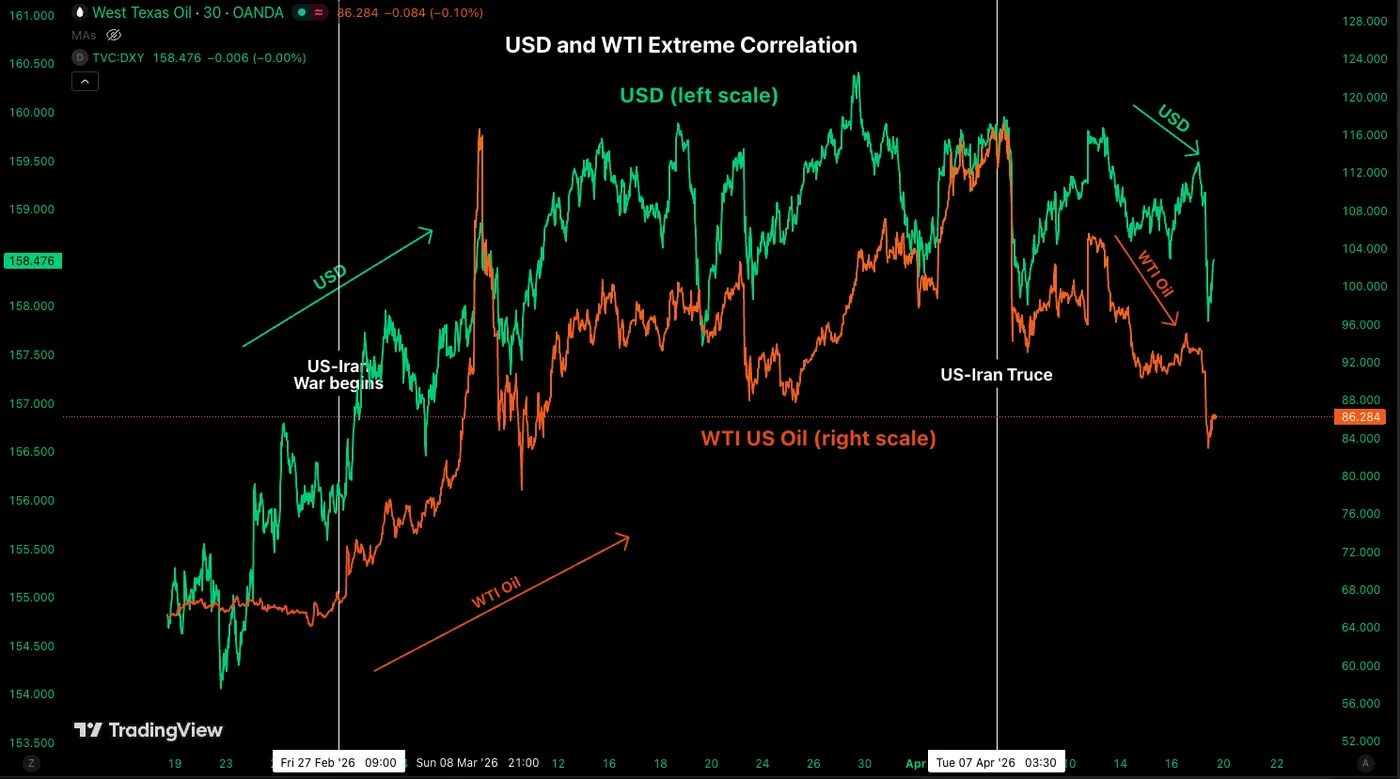
Petrodollar trade – the correlation of oil with the US dollar. Source: Trading View. April 21, 2026
With markets euphoric over the US-Iran deal and the fact that the war does not extend much longer than originally priced, it has led to an explosion to all-time highs in the stock markets, a rapid decline in oil prices and, consequently, a decline in the US dollar.
This came shortly after the global reserve currency’s daily double top, which was nice enough to mark a bearish pattern signaling a shift in how markets view the war.
But after the 2.50% correction, the US dollar seems to have corrected. So, if the dollar predicted a truce, can it now predict tougher times ahead?
The problem with the narrative is that the ceasefire ends tomorrow, and a US delegation, including Vice President J.D. Vance, is struggling to coordinate its departure amid conflicting messages from the Iranian side.
As the US President said, he does not want to extend the ceasefire, and without reaching an agreement, we will go straight back to bombs. So the FX markets may feel the shift.
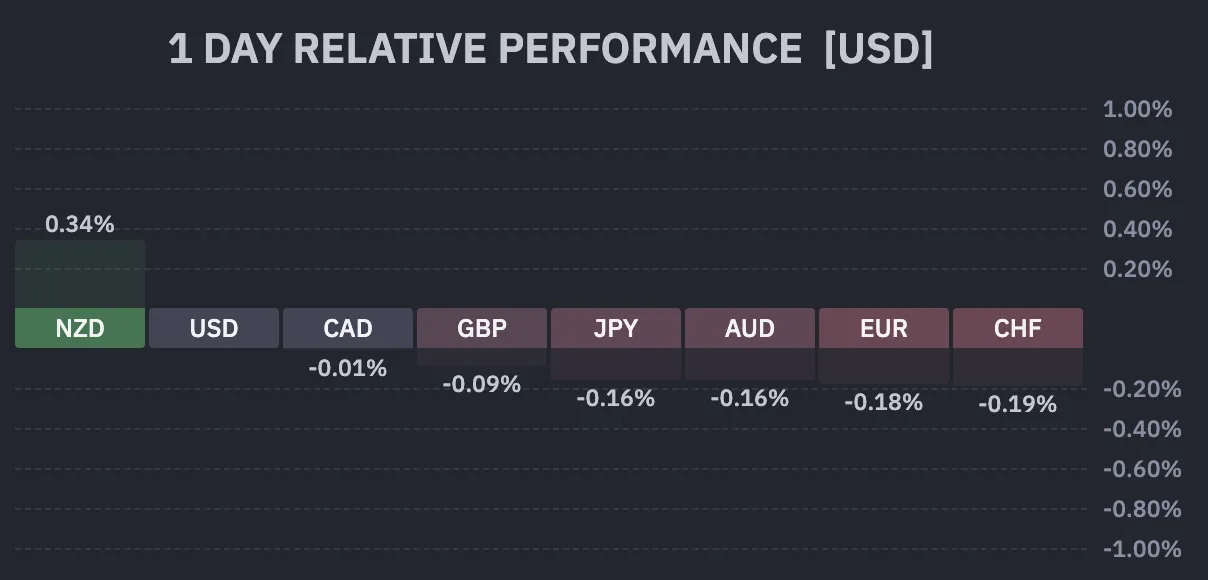
Forex performance during the current session – Courtesy of Finviz. April 21, 2026
The US dollar leads all other Forex currencies, but the New Zealand dollar is supported by the beat of the New Zealand CPI and repricing to raise its price at the next meeting.
Although the changes are small, this is the second day in a row that the dollar has rebounded, so traders will have to pay close attention.
We will look at the Dollar Index, EUR/USD, and AUD/USD to assess the current state of the market and where to look next.
4-hour dollar index chart
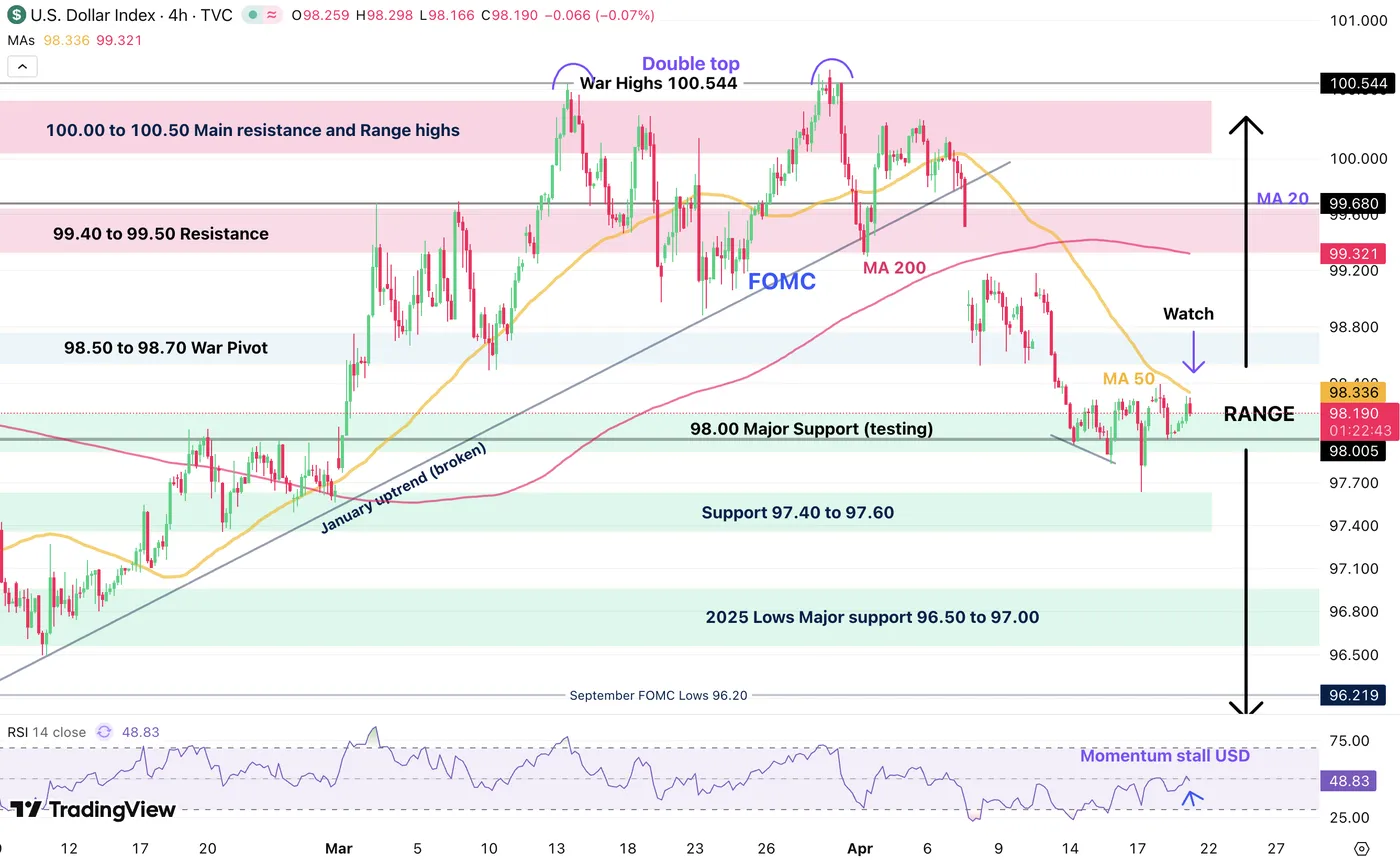
Daily chart of the dollar index, April 21, 2026 – Source: TradingView
The US dollar now tried and failed to break the key support level of 98.00 for the third time during the morning action.
These levels remain in the middle of their larger time frame range, meaning there is no general conviction among the bears that the dollar should actually erase its gains from the war.
Now with a test of the 4-hour and 50-period moving average, a key technical indicator of the previous coming, the forex markets will face a test:
- A break above it (98.40) would signal a future bullish recovery, confirming above 98.70 (if war breaks out again)
- On the other hand, rejecting the 98.00 level continues the downward path for the US dollar
Levels of interest in the dollar index:
Resistance levels
- 98.335 50-hour moving average (bullish above)
- 98.50 to 98.70 Axis of War
- Resistance 99.40 to 99.50
- Initial war high 99.68
- Weekly range is high 100.00
- The main resistance area is from 100.00 to 100.50
- Highest levels of war 100.544
Support levels
- 98.00 2025 Support (test – bearish below)
- Support 97.40 to 97.60
- 2025 lows from 96.40 to 96.80 support
AUD/USD 4-hour chart and technical levels
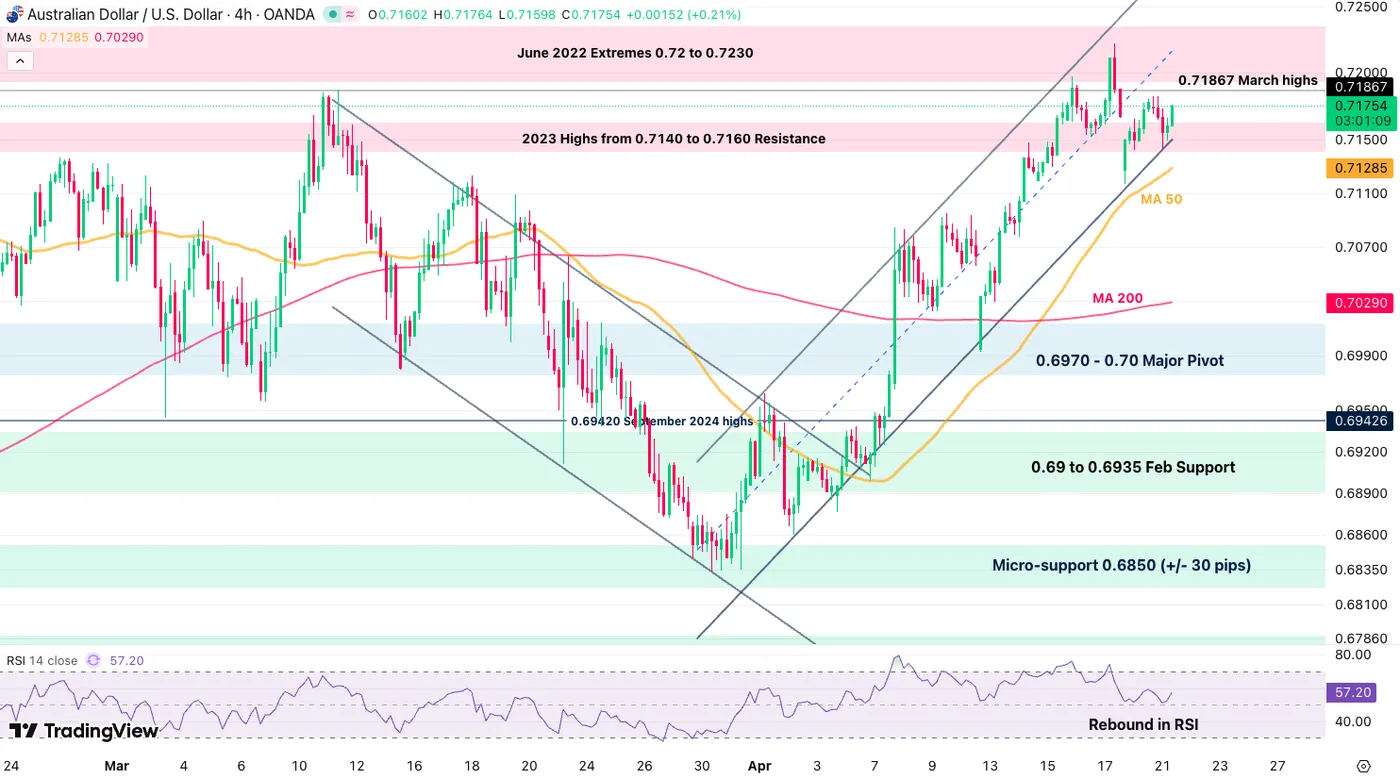
AUD/USD 4-hour chart, April 21, 2026 – Source: TradingView
The AUD/USD pair has been making somewhat of an advance, bouncing from a test of the bottom of an ascending channel in the recent move.
A break above 0.71860 (March highs) will continue the upward trajectory forward and if the channel holds (indicating peace), a rise to 0.7250 may occur.
However, the bounce attempt looks very timid at the moment, hence the importance of the March high. Failure to reject it may result in a break of the upward channel.
Interest levels for AUD/USD:
Resistance levels
- 2023 highs 0.7140 to 0.7160 resistance (broken)
- 0.71867 March highs
- June 2022 Maximums 0.72 to 0.7230
- Channel highs 0.7250
Support levels
- 0.7150 channel lows
- 4-hour and 50-period moving average – 0.71280
- 0.6970 – 0.70 major axis
- Support from 0.69 to 0.6935 early February
- 0.68340 Lowest levels of war
EUR/USD 4-hour chart and technical levels
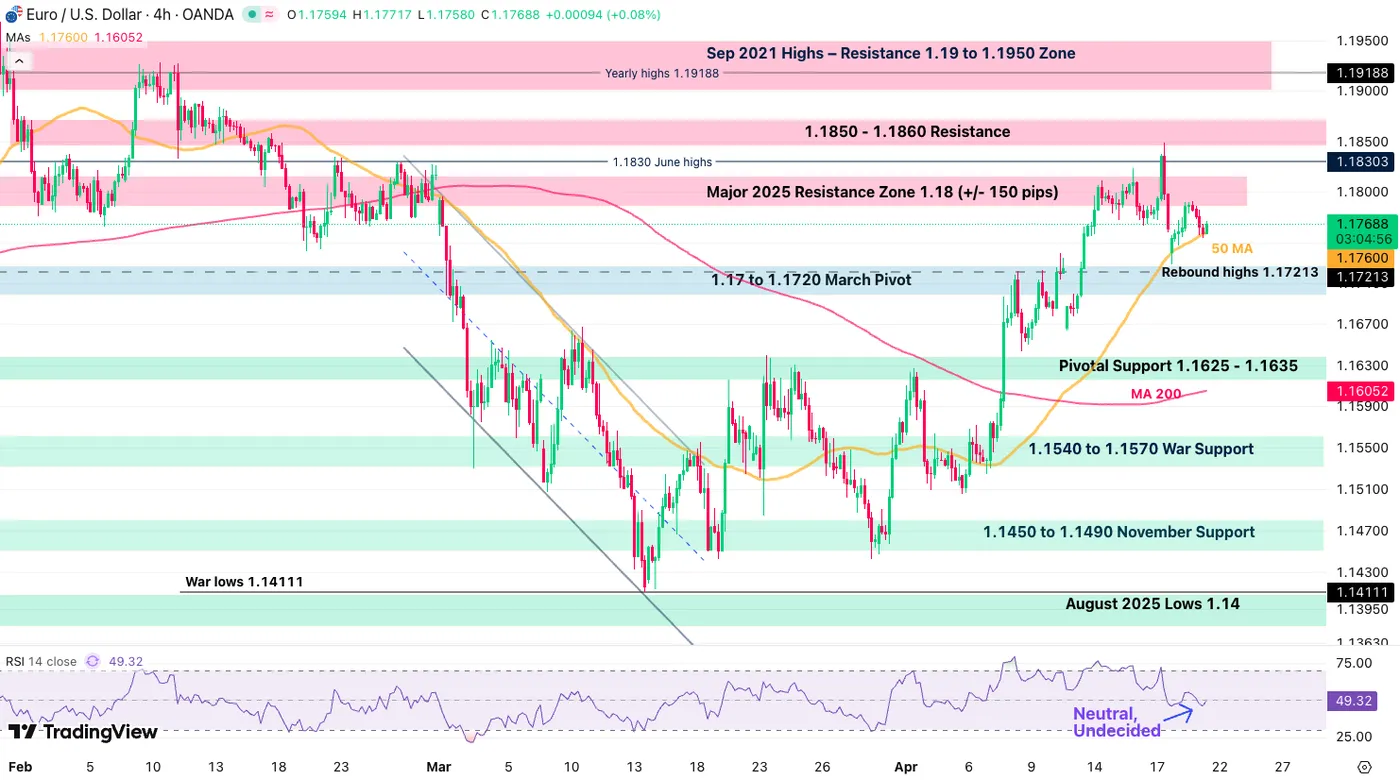
EUR/USD four-hour chart, April 21, 2026 – Source: TradingView
The EUR/USD pair is showing sharply similar signals to the dollar index (naturally, in the opposite direction), testing its 4-hour and 50-period moving average this time as support.
Bears had the upper hand at the start of the week, sharply rejecting a test of resistance at 1.1850 and now trading near 1,000 points below.
A break of the moving average indicates further downside, with confirmation below 1.17200.
Levels to place on your EUR/USD charts:
Resistance levels
- Resistance area is around 1.18 (+/- 150 pips)
- 1.1830 June 2025 highs
- 1.1850 to 1.1860 last test
- September 2021 highs – resistance zone 1.19 to 1.1950
Support levels
- 1.1760 4H 50 period MA
- 1.17 to 1.1720 March pivot
- High bounce at 1.17200 (bearish below)
- Major Pivot 1.16250 to 1.16350
- 1.1540 to 1.1570 support the war
- Support from 1.1475 to 1.15 November
- War lows 1.1410
Safe deals and closely monitor the ceasefire news!


