

Key takeaways
- The decline is driven by geopolitical risks and the strength of the US dollar: The EUR/USD pair fell about 1.5% from its recent high, as stalled talks between the US and Iran and rising oil prices boosted safe-haven demand for the US dollar.
- The macro backdrop turns supportive of the euro: The sharp spread between interest rates between the Eurozone and the US suggests that the ECB is relatively less dovish versus the Fed, providing fundamental support for EUR/USD.
- Technical setup indicates a possible recovery: The price is testing the key support at 1.1665/1.1635 with bullish signals (trend above the main moving averages, RSI divergence, and up channel), indicating a potential reversal unless the support is broken.
The EUR/USD pair reached a two-month high of 1.1849 hit last Friday, April 17, 2026, and became weakened by the faltering second round of US-Iran peace talks, falling 1.5% to reach a low of 1.1669 on Thursday, April 23, 2026.
Second, cracks have appeared in the extended ceasefire agreement, with both sides using force to prevent oil tankers from crossing the Strait of Hormuz, sending oil prices up 10%, increasing the attractiveness of a short-term safe-haven demand position on the US dollar.
Interestingly, the EUR/USD five-day decline from its two-month high has reached an inflection zone for a potential bullish reversal from a technical analysis and internal markets perspective.
Let us explore these factors in more detail.
The spread of the implicit interest rate policy curve has sharpened in the Eurozone/US
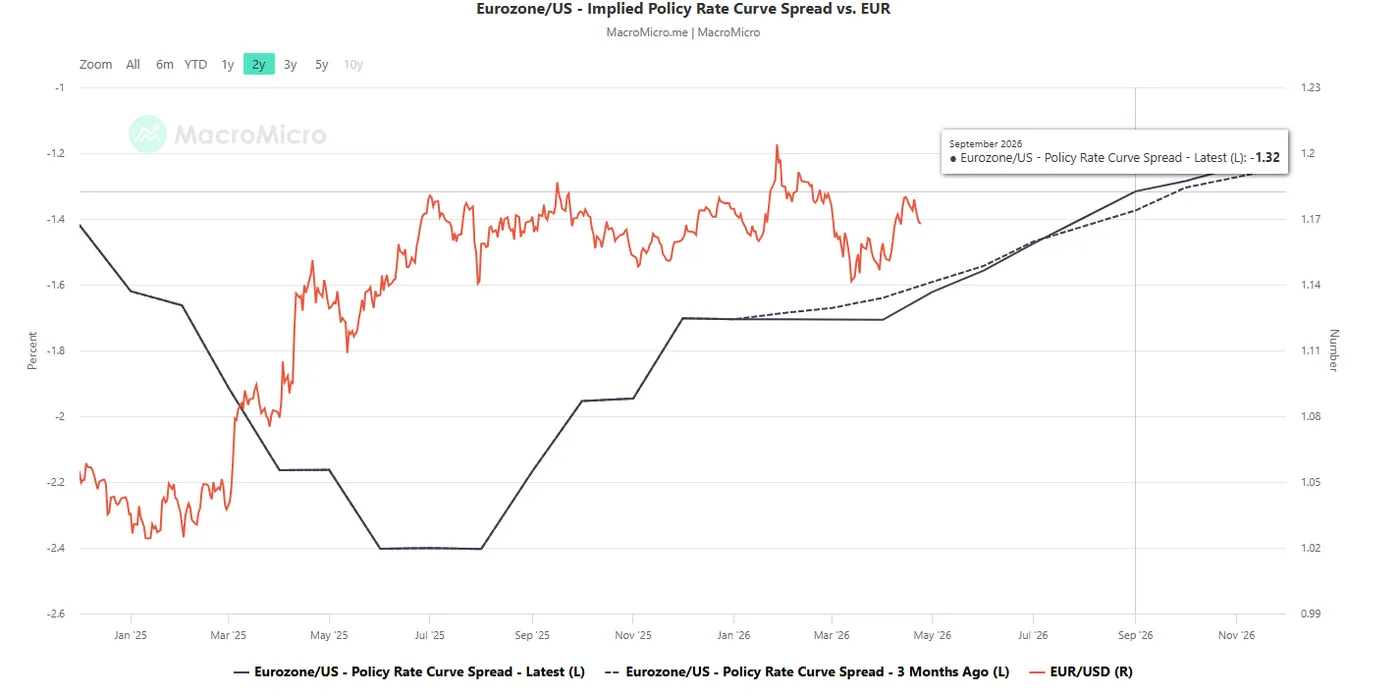
Figure 1: Spread of the implied interest rate policy curve between the Eurozone and the United States as of April 23, 2026 (Source: MacroMicro).
The monthly implied future interest rate curves for the euro area and the United States are calculated using short-term interest rate futures which are highly sensitive to expectations about the monetary policies of the central banks of these countries
The current implicit interest rate policy curve in the Eurozone and the US for May 2026 to September 2026 is higher than it was three months ago, with the current reading for September 2026 at -1.32% compared to -1.37% three months ago (see Figure 1).
These observations suggest that the ECB is likely to be less dovish or more hawkish than the Fed, which in turn could provide support to EUR/USD.
Let us now focus on the likely short-term path (1-3 days) of the EUR/USD pair.
EUR/USD – Secondary uptrend phase from March 13, 2026 low remains intact
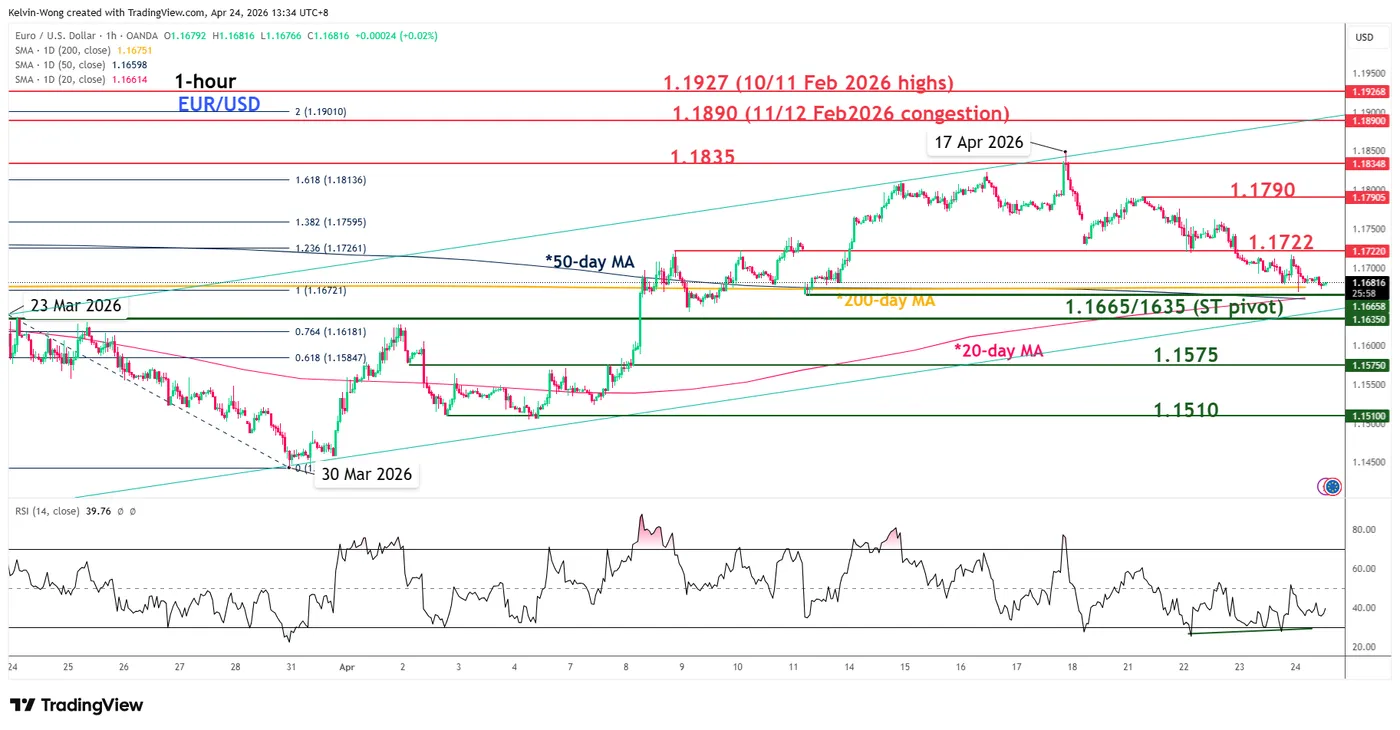
Figure 2: Secondary trend of EUR/USD as of April 24, 2026 (Source: TradingView).
Despite the five-day decline in the EUR/USD pair, price action is still trading above the 20-day, 50-day and 200-day moving averages.
Keep an eye on the short-term key pivot support 1.1665/1635, a break above 1.1722 (potential bullish trigger) could trigger the next intermediate resistance at 1.1790, 1.1835 and 1.1890 (also Fibonacci extension) (see Figure 2).
On the other hand, failure to hold at 1.1635 and closing below it invalidates the bullish reversal scenario to see the continuation of the corrective decline to reveal the next intermediate support at 1.1575 and 1.1510.
Key elements to support the near-term uptrend for EUR/USD
The EUR/USD five-day decline has reached the crossover zone between the 20-day, 50-day and 200-day moving averages, with the 20-day moving average now forming an imminent bullish crossover above the 50-day moving average.
EUR/USD price movements continued to fluctuate within its secondary ascending channel that has been in place since the lowest level on March 30, 2026.
The hourly RSI momentum indicator formed a bullish divergence into the oversold zone on Thursday, April 23, 2026.


