
The top 3 meme coins on the weekly radar are divided into very different technical paths. BUILDon (B) extends the breakout, MemeCore (M) loses key support, and Siren (SIREN) curls below the downtrend line that has defined the price ceiling since March.
Daily charts show BUILDon pressing the 0.618 Fibonacci retracement level at $0.48, while MemeCore corrects toward $3.27 after rejection near $4, and SIREN tests the 0.786 Fib retracement level at $1.07 as volatility increases.
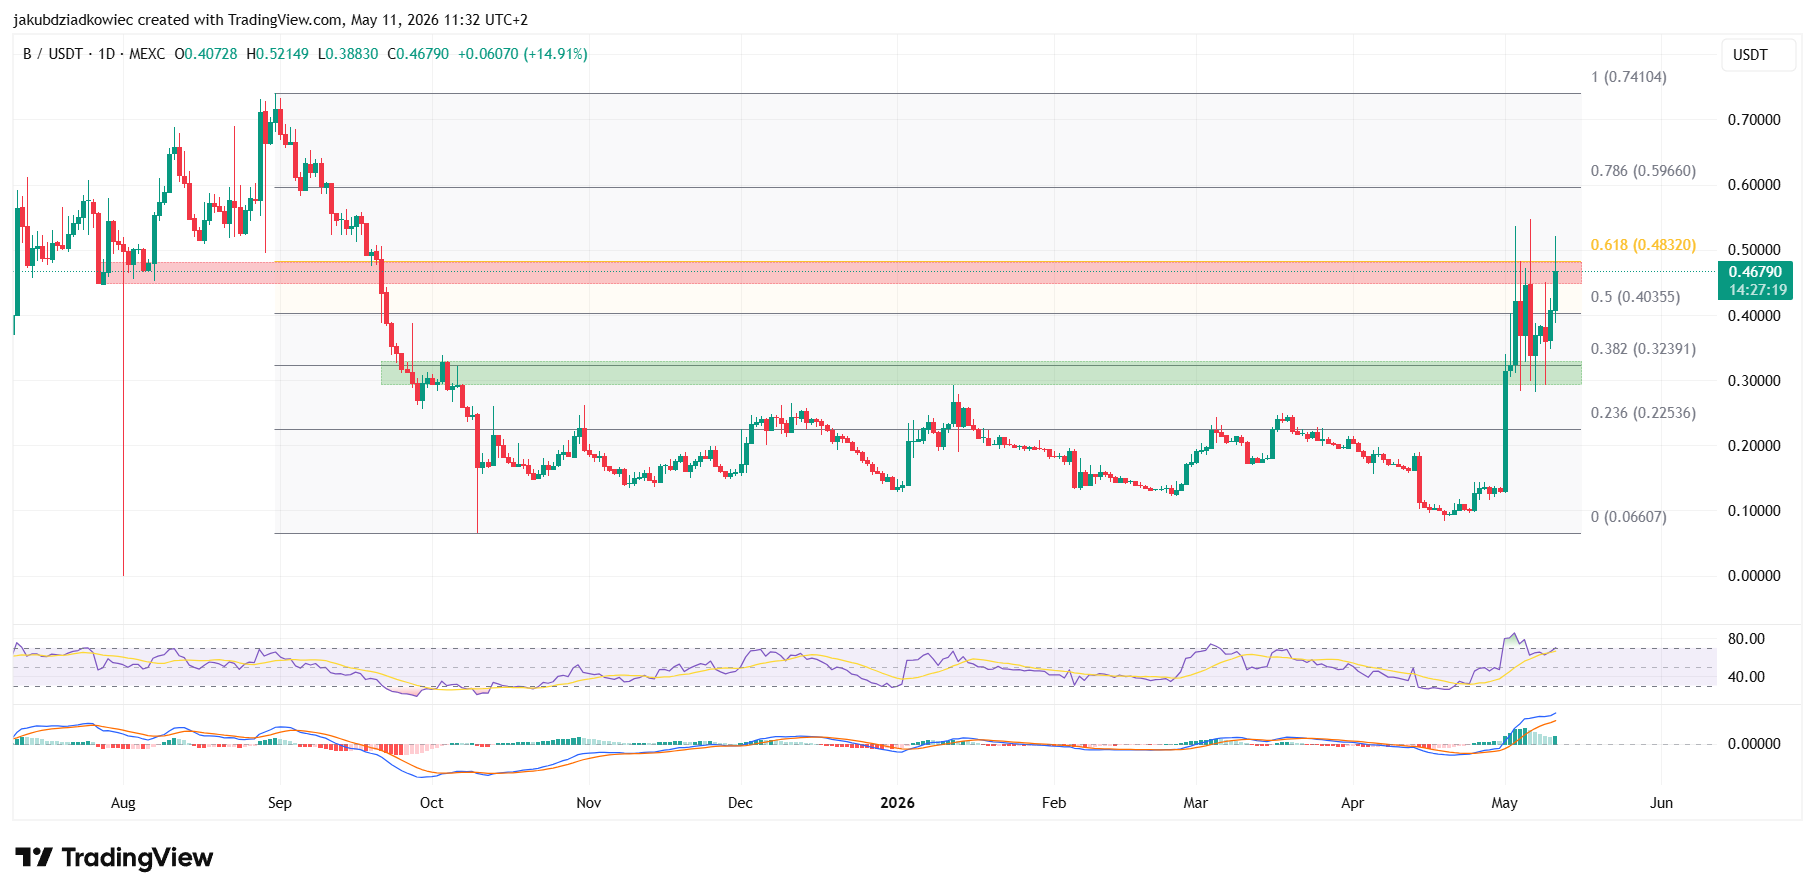
BUILDon (B) Bulls are pressing the $0.48 resistance level for the third time
Beldon It is trading near $0.4679 after a daily gain of 14.91%, with intraday highs near $0.52 and lows at $0.38. The coin spent months within a broad accumulation zone between $0.09 and $0.30 dating back to September 2025.
The price broke this range on May 1 and confirmed the 0.382 level Fibonacci Bounce at $0.32 as new support. However, it has rejected the 0.618 level at $0.48 B in three separate attempts so far in May.

The Relative Strength Index (RSI) is near the 70 level, deep in bullish territory. Meanwhile, the Moving Average Convergence Divergence (MACD) prints a longer green histogram bar after a brief pause, indicating renewed bullish momentum.
A confirmed daily close above $0.48 would open the way towards the 0.786 Fibonacci level near $0.60. Failure to clear this resistance could send the price back towards the $0.32 support shelf.
MemeCore (M) slides back after losing curved support
In contrast to Beldon, MemeCore It is trading at $3.27 after a daily decline of 1.24% and showing clear technical weakness. Price action lost the exponential support curve at the end of April, ending the steady advance that had continued since February 1.
After this breakdown, M corrected to the 0.618 Fibonacci retracement level at $2.59 before bouncing higher. The recovery retested the broken curve as resistance on May 7, then stopped at $4 at the 0.236 Fibonacci level.

The MACD is now printing longer red histogram bars, which indicate expanding bearish momentum. The RSI is hovering in the neutral zone but its trends are lower, warning that the selling pressure has not yet been absorbed.
A second visit to $2.59 remains the base case if the current pullback continues. On the upside, the bulls will need to reclaim $4 to negate the bearish setup, with the previous high near $4.85 being the next major hurdle.
Siren (SIREN) wraps below the trend line as volatility returns
Siren It presents a different setup again, with price pressing below the downtrend line dating back to March 23. The line was confirmed as resistance on April 17 and was tested again on May 9.
SIREN is currently trading at $1.17, near the 0.786 Fibonacci retracement at $1.07, which has been a near-term magnet. Volatility, measured by the Bollinger Band Width Percentage (BBWP), has recently sat at very low readings consistent with a contraction phase.

However, from May 6 to May 8, price activity began to expand again, with volatility rising although readings had not yet reached extreme areas. The RSI is near 60 and sloping to the upside, enhancing the building momentum.
A break above the trend line would extend gains towards the 0.618 Fibonacci retracement level at $1.85 and then $2.40. Long-term support is near $0.75, and a daily loss of $1.07 would bring this bottom back into play.
this post Top 3 Meme Coins to Watch This Week as BUILDon Targets $0.60 Breakout appeared first on BeInCrypto.


