

- The US dollar has enjoyed a very consistent performance since the beginning of the US-Iran conflict but is now forming a double top
- As traders begin to price a solution to the conflict, the dollar may lose some strength, especially at the top of its range
- US Dollar Index (DXY) In-depth technical analysis
Timing Markets is a difficult task, and it is absolutely essential to making the most profits possible from important fundamental setups.
It’s really important to time your trades to ensure entries remain favorable and your risk-to-reward ratio stays positive – but a key part of timing is not being too early.
The US dollar has been in a major uptrend since the end of the January FOMC meeting (as expected here) and is now testing the extremes of its massive 95.50-100.50 range.
This is where timing entries become a tedious task – one can start selling the US dollar as soon as it hits the highs, but when double tops occur, they often come in to get your stops.
This is when confirmation steps in to provide more appropriate input and timing – it can be fundamental, with a change in the narrative (something that has begun to appear recently), or confirmation in technical matters.
Sometimes it can be both, and that’s what can now be offered in USD.
Nothing is certain in the markets, especially during volatile periods when breaking news can change the entire picture in a matter of seconds – but at least, some settings can look better than others.
As we speak, the US dollar is rejecting its war highs for a third test in a row, forming a double top – both the US and Israel are slowly looking to turn the page on an entire month of operations, especially with the Trump administration considering ending the conflict without taking control of the Strait of Hormuz to punish European and Asian allies who have not shown an appetite for such operations (and even opposed them, like Spain).
The reversal, if it does happen, may not unfold in a single session, but rather in progressive waves as the narrative slowly shifts.
Crude oil prices still determine overall market flows, so a decline should serve as an additional confirmation signal.
We’ll explore some scenarios for a potential major reversal in our in-depth technical analysis of DXY.
Dollar Index (DXY) multi-time frame analysis
Daily chart
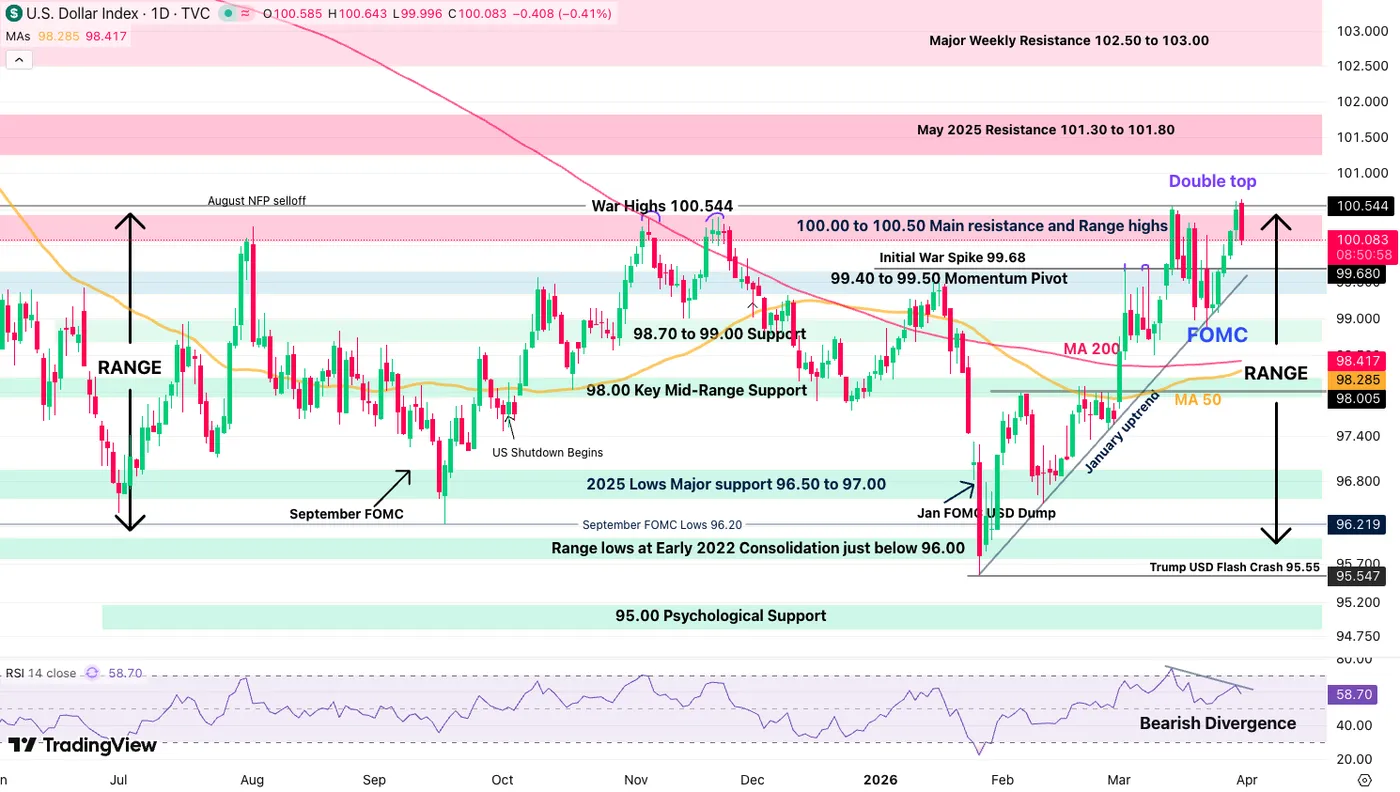
Daily chart of the dollar index (DXY). March 31, 2026 – Source: TradingView
While headline chasers get fooled by the latest dollar demonetisation and end of the global narrative, it is essential as traders to take a step back, silence the noise, and see if any real trend is emerging to avoid getting caught in confirmation bias loops and missing out on great opportunities.
For example, the same thing happened after the sudden collapse of the US dollar led by Trump before the FOMC meeting, where the financial world as a whole would have sworn that the US dollar was finished.
But here we are at a 6-month high. The large range established after the July 2025 TACO lows for the dollar is still holding (although at the top and bottom).
It is now reacting at the highs, and it will be interesting to see if a bearish reversal occurs from here, especially after the double top and bearish divergence of the daily RSI.
4-hour chart and technical levels
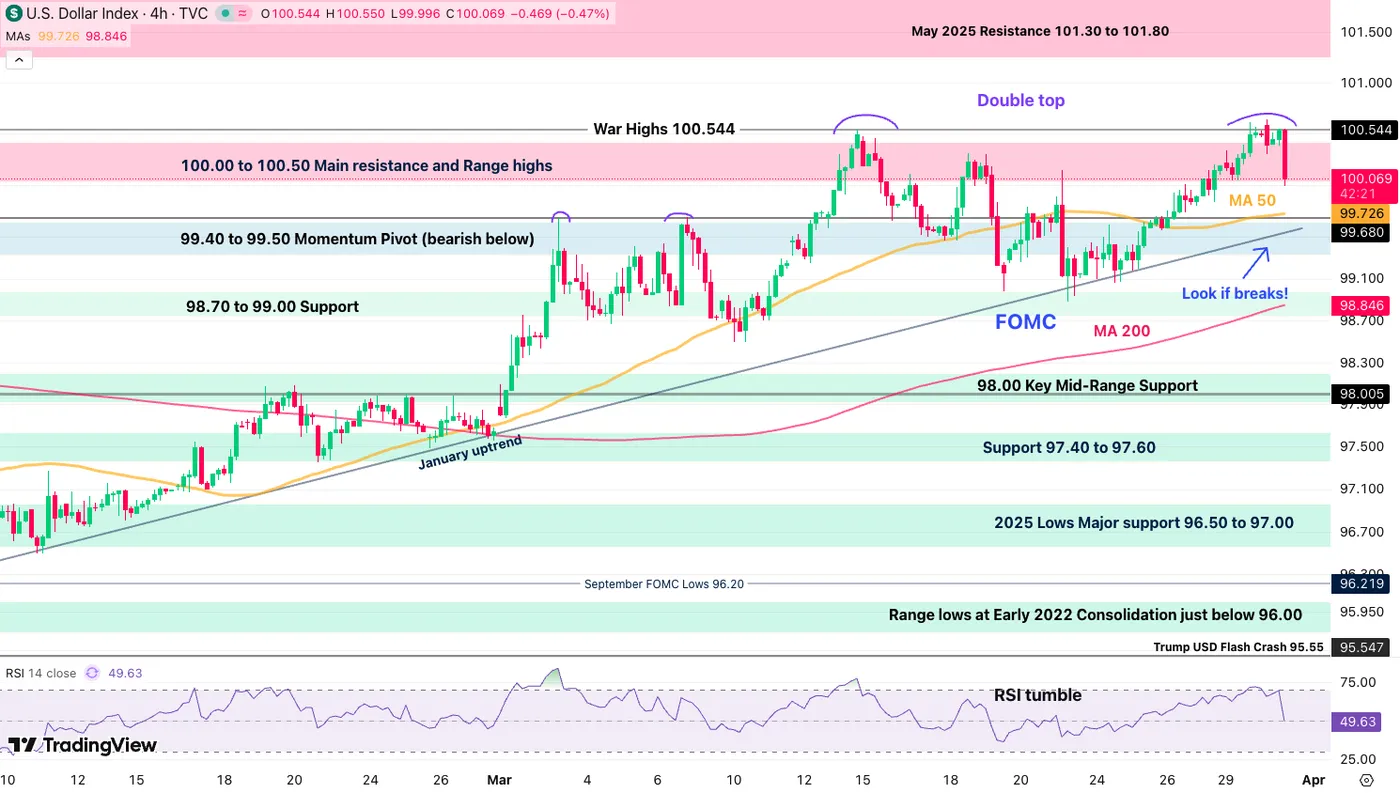
Dollar Index (DXY) 4-hour chart. March 31, 2026 – Source: TradingView
The dollar officially rejects its war high of 100.50, forming the famous double top, with momentum quickly shifting.
As long as prices remain within the 100.00 to 100.50 area, the movement is more balanced than bearish, so it may be a good time to search the markets for interesting setups – two elements to look for are:
- Will buyers return at short-term support levels? (4-hour 50-MA and January uptrend ~99.70)
- If they don’t, what is the optimal forex pair to trade to catch a potential reversal?
- In this case, look for trades that express this opinion in other Forex pairs (AUD/USD, USD/JPY, USD/CAD?)
- And do not forget that such a reversal does not happen in one quick move! They also have retreats and more.
Levels to place on your DXY charts:
Resistance levels
- From 100.00 to 100.50, the main resistance and highs of the range
- War highs 100.544 (double top)
- May 2025 resistance from 101.30 to 101.80
- Main weekly resistance 102.50 to 103.00
Support levels
- Small support 99.70
- 99.40 to 99.50 momentum pivot (bearish below)
- Support 98.70 to 99.00
- 98.00 medium term support
- Support 97.40 to 97.60
- 2025 lows. Main support from 96.50 to 97.00
One hour chart
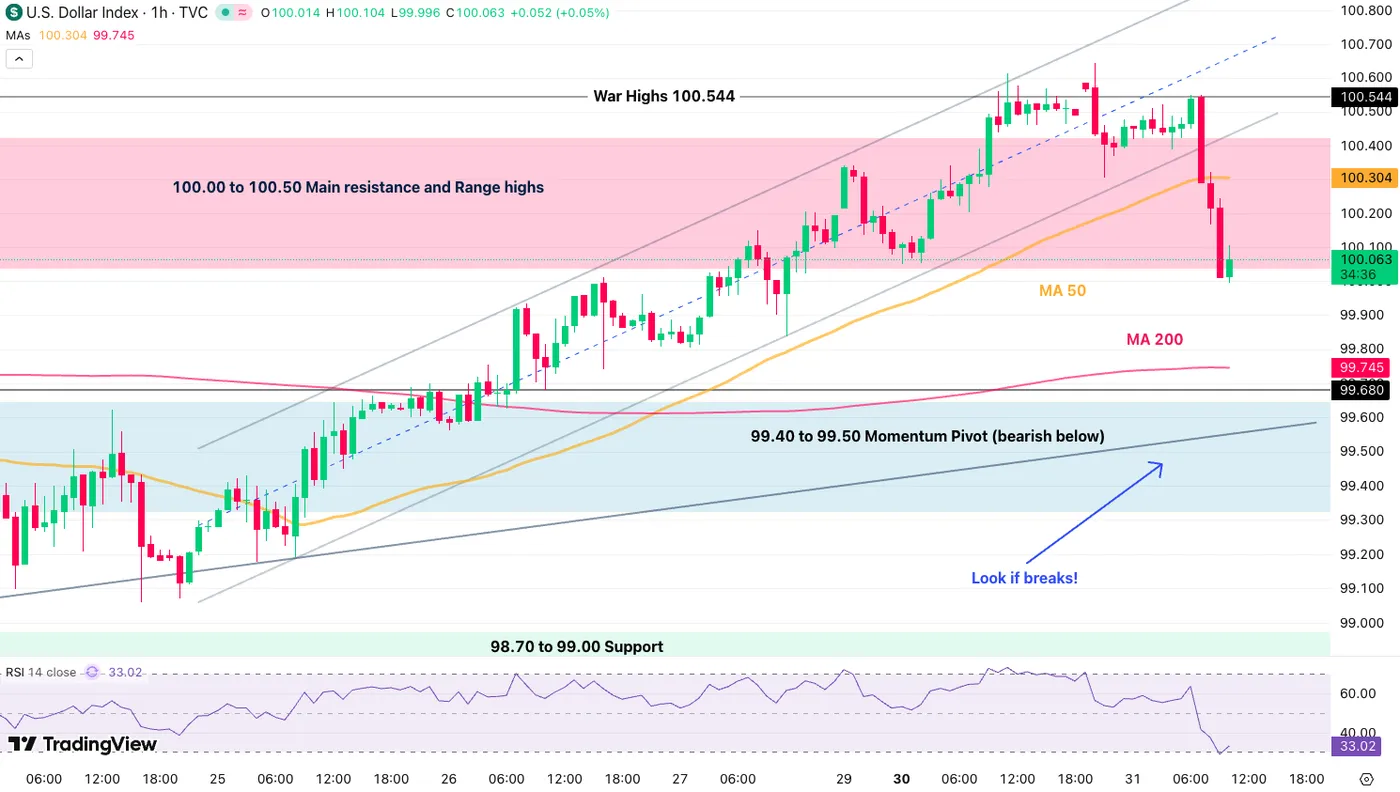
Dollar Index (DXY) hourly chart. March 31, 2026 – Source: TradingView
The US dollar is now bouncing slightly after quickly reaching oversold RSI levels around the clock – look for a small bounce for entries on major forex pairs.
Psychological levels tend to attract good reactions in the currency market, and a return to the 50-hour moving average (100.30) would provide an ideal setup for selling the US dollar, as long as the narrative does not change again and the war lasts longer.
To invalidate short selling, watch if the bulls will be able to pull the dollar above 100.55 and close above it daily.
Safe deals!


