

- Bitcoin price faces a potential drop to $73,850, as overall supply pressure from the 20 and 50-day EMA could hamper the recovery momentum.
- Heatmap of Bitcoin’s aggregate liquidation levels indicates that a 6-7% decline could lead to prolonged, widespread unwindings across exchanges.
- The 30% Cryptocurrency Fear and Greed Index indicates renewed bearish sentiment among market participants.
The native cryptocurrency, Bitcoin, shows a slight rise of 0.56% during the opening bell of US market hours on Monday to trade at $77,393. The jump came in the wake of geopolitical developments in the Middle East as Iran says talks are focused on ending the war, leading to a sharp 5% drop in crude oil prices. The move eased pressure on the energy sectors and inflation fears in global markets, prompting investors to once again focus on risky assets including cryptocurrencies. However, a liquidation setup increases the odds of a downward move in the Bitcoin price due to the structural asymmetry between perpetual and short futures contracts.
The liquidation heat map indicates asymmetric risks for Bitcoin traders
Bitcoin price is currently hovering around the $77,441 level, drawing close attention from derivatives market trading. Over $14.3 billion of total liquidation exposure is accumulated around current price levels, with a roughly balanced split between long and short positions.
On the downside, long positions show particularly dense clusters, which increases the risk of cascading liquidations. The roughly $1.61 billion in long exposure sits near $73,716. A deeper decline in the ongoing correction will quickly intensify selling pressures, with cumulative liquidation pools reaching $3.85 billion at $73,281, $5.42 billion at $72,702, and $7.14 billion at $72,122. This suggests that a 6-7% decline could lead to prolonged liquidations across many exchanges.
Conversely, exposure on the upside is more widespread. Notable combinations include $1.66 billion near $78,786, rising to $3.68 billion at $83,422, $5.57 billion at $84,146, and $7.20 billion to $88,202. A wider space between potential resistance areas indicates less immediate congestion compared to the support areas mentioned above.
Heatmaps from the combined platforms show different shades of these filtering areas with brighter colors indicating higher estimated volume. Bitcoin’s current price action indicates a compressed support area below and extended resistance above, which could lead to higher volatility if… Bitcoin Separators on both sides.
the The attached chart is from Alfractal Provides a clear, multi-exchange view of where order flow and forced liquidations may drive momentum in the coming sessions.
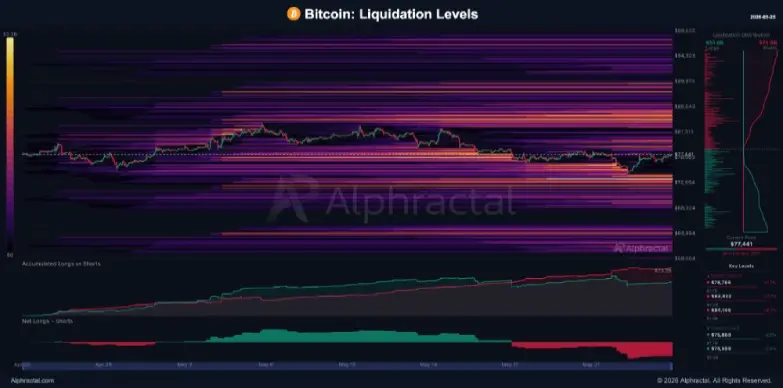
Overall, the asymmetric pattern (heavy long clusters and broad-based short positions) indicates that Bitcoin is likely to continue trading within a range until a major catalyst emerges. A downside breakout will likely result in exaggerated volatility and stop-loss chasing, while prolonged buying activity may eventually take short trades out of the market and bring in new capital.
Bitcoin price correction may extend another 4.5% support before reaching major support
During the past two weeks, Bitcoin price It decreased from $82,458 to the current value of $77,393, which represents a 6.3% decrease. The pullback pushed Bitcoin below its 20- and 50-day EMAs, and the broader cryptocurrency fear-greed index returned to 30%, highlighting negative near-term market sentiment.
Even today’s intraday jump shows a noticeable price rejection candle at the $77,640 level, indicating a healthy overall supply for Bitcoin. Bitcoin0.50%. Hence, the coin price shows a higher probability of falling by 4.5% and challenging the lower support trend line of the ascending channel pattern at $73,850.

From a technical perspective, this retest remains a pivotal level for the near-term trend in Bitcoin price as a potential breakdown will accelerate selling pressures, while a sustained reversal could fuel a further recovery.