

Key points
- Bitcoin fell significantly below $70,000 before the bulls emerged.
- A downtrend line is forming with resistance at $72,500 on the 4-hours chart of the BTC/USD pair.
- Ethereum is still in a bearish zone below $2,150.
- Gold may start another decline if it drops below $4,400.
Technical analysis of Bitcoin price
Bitcoin price failed to stay above $75,000 against the US dollar. BTC reacted to the downside below $72,000 and $70,000.
Looking at the 4-hour chart, the price has settled below the $70,000 handle, the 100 SMA (red, 4-hours), and the 200 SMA (green, 4-hours). It even rose to less than $67,500. If the bulls attempt a rally, they could face resistance at $69,500 and the 23.6% Fibonacci retracement level of the recent decline from the $77,988 swing high to the $66,925 low.
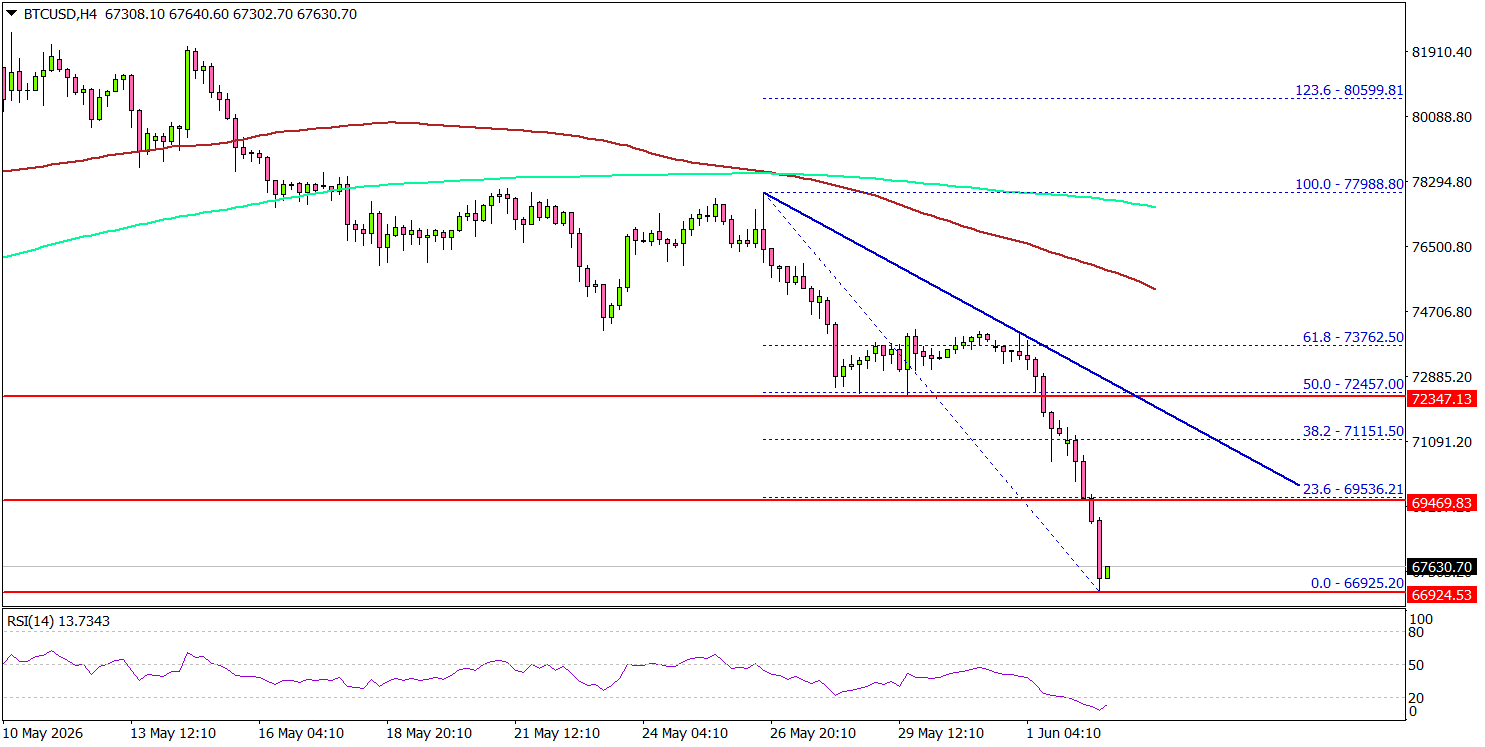
The first major resistance could be $71,200. Key resistance could be near the trend line at $72,500 and the 50% Fib retracement level of the recent decline from the swing high at $77,988 to the low at $66,925.
A close above $72,500 could send the price towards $74,200. Any further gains may require a $75,000 test. If there is a new low, immediate support could be $66,500.
The first major support could be $65,000. The main breakout support could be $63,500. A bearish break below $63,500 could start another decline. The next major support could be $60,000, after which Bitcoin could drop to $58,000.
Looking at Ethereum, the price has also gained bearish momentum below $2,120 and is still at risk of further decline.
Today’s major economic releases
- US S&P Global Services PMI May 2026 – Expected 50.9, versus previous 50.9.
- US ISM Services Index for February 2026 – Expected 53.8, versus previous 53.6.


