

Key points
- Gold started a new decline below the $4,400 support level.
- A major bearish trend line is forming with resistance at $4,480 on the 4-hours chart.
- WTI crude extended its losses and traded below the $92 level.
- The EUR/USD pair started a slight recovery wave above the 1.1520 level.
Technical analysis of gold price
Gold failed to cross the $4,600 level and began a new decline against the US dollar. The price fell below $4,550 and $4,500 to enter the bearish zone.
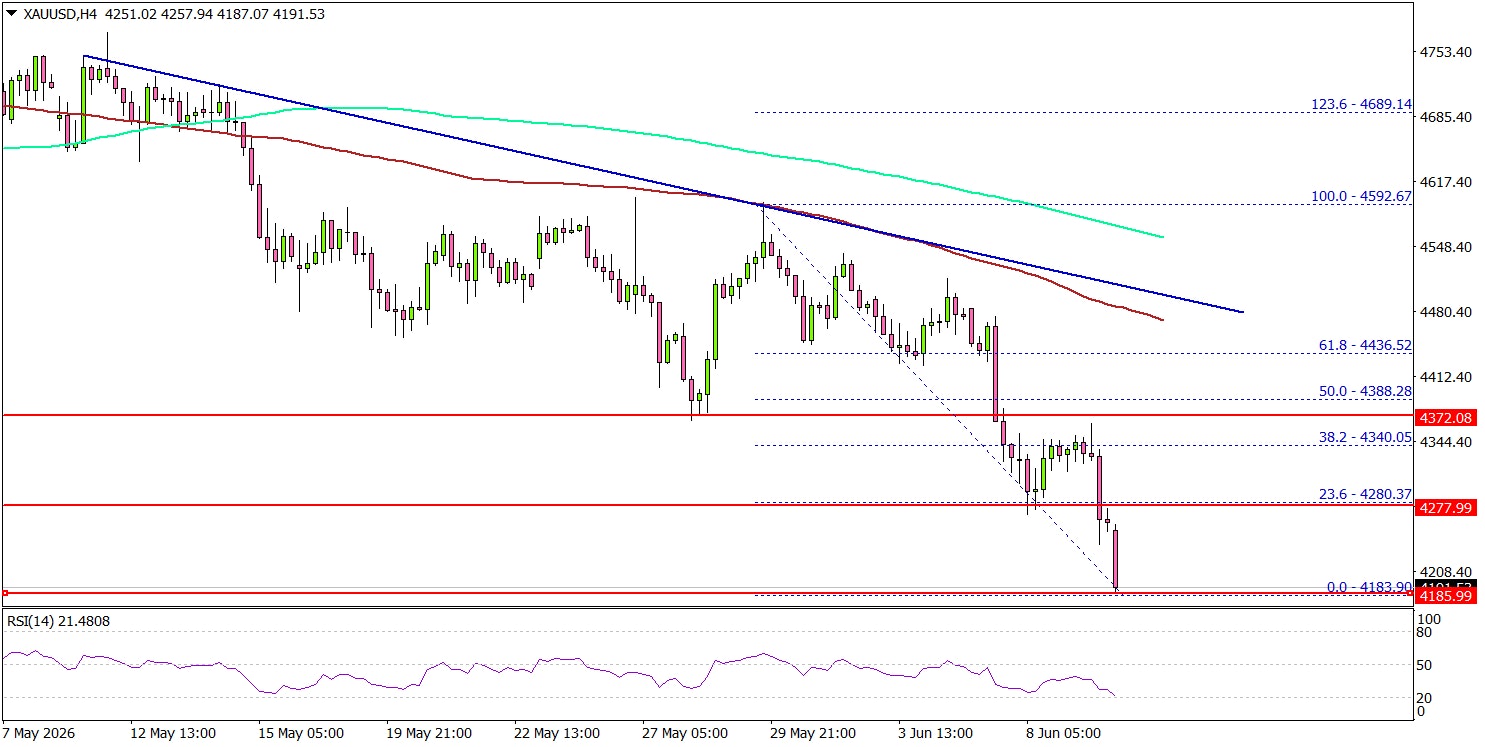
The 4-hours chart of XAU/USD indicates that the price also fell below $4,400, the 100 SMA (red, 4-hours), and the 200 SMA (green, 4-hours). The bottom was formed at $4,183, and the price is now showing several bearish signals.
On the upside, immediate resistance is $4,250. The next major resistance is near $4,280 and the 23.6% Fib retracement level of the downward move from the high of $4,592 to the low of $4,183.
The main resistance could be near $4,285 or the 50% Fibonacci retracement level. A close above $4,285 could send the price towards $4,500. There is also a major downtrend line forming with resistance at $4,480. A clear move above $4,480 could open doors for further upside. In the mentioned case, the bulls could aim for a move towards $4,550 or even $4,600.
If there is another decline, gold may find bids near the $4,150 level. The first major support is located at $4,065. The next support level might be $4,000, without which the price might drop to $3,800. Major support is located at $3,550. Any further losses may require a test of $3,300 or even $3,200 in the coming days.
Looking at WTI, the price has started a new decline and there are chances of further losses below the $90 area.
Economic releases to watch today
- US CPI May 2026 (MoM) – +0.5% expected, vs. +0.6% previously.
- US CPI May 2026 (YoY) – Expectations +4.2%, vs. +3.8% previously.
- US CPI excluding food and energy May 2026 (YoY) – forecast +2.9%, vs. +2.8% previously.


