

Key takeaways
- USD/JPY remains supported by the growing yield differential between the US and Japan. Markets are increasingly pricing in a more hawkish Fed, with expectations growing for a Federal Reserve rate hike later in 2026, while the Bank of Japan looks likely to slow or halt its bond tapering program despite an expected rate hike next week.
- The pair is approaching the main intervention zone near 160.40-160.70. Japanese authorities already spent a record amount defending the yen earlier this year, making this an area a critical level where renewed risks of verbal or direct intervention may emerge.
- Technical momentum remains building in the near term. The USD/JPY pair continues to trade within a medium-term rising wedge and a short-term ascending channel, with momentum indicators remaining supportive for further progress towards the 160.65, 161.14/20, and 161.60/95 resistance levels.
US CPI shock and hawkish Fed
Today’s US CPI reading enters the market, facing macro headwinds and energy shocks stemming from the ongoing conflict in the Middle East. After the complete evaporation of the Fed’s bets on a 2026 rate cut, the market is in a strong position for a stable yield curve environment under the leadership of Fed Chairman Kevin Warsh. With futures now priced at a 61% probability of A 25 basis points rise In October, an upward surprise in today’s CPI, which will likely push inflation to multi-year highs, will entrench the bullish regime for a longer period and maintain structural upward pressure on the greenback.
BOJ Balancing Action – June rate hike in exchange for a temporary pause in bond tapering
Next week (June 15-16), the Bank of Japan is widely expected to shift its rhetoric toward becoming an active “inflation fighter.” Aggregate polls show that nearly 94% of economists expect Governor Ueda to raise interest rates by 25 basis points, raising the short-term interest rate to 1.00% from 0.75%, a level last seen in 1995. This hawkish tilt responds directly to persistent inflationary impulses resulting from the war between the United States and Iran.
Crucially, to ease political friction with Prime Minister Sunny Takaishi and stabilize the volatile sovereign bond market, where the yield on 10-year Japanese government bonds recently reached a 30-year high of 2.8%, the Bank of Japan is leaning toward it. Stop or slow down the taper in bond purchases next fiscal year.
By freezing further monthly purchase cuts (and perhaps keeping them steady near 2.1 trillion yen), the central bank hopes to limit the explosion in debt servicing costs before yields cross the painful 3% threshold.
The two-year US Treasury/JGB yield spread is widening
Figure 1: 2- and 10-Year US Treasury Yield Spreads as of June 10, 2026 (Source: TradingView). The information provided is historical information, and past performance is not indicative of future performance.
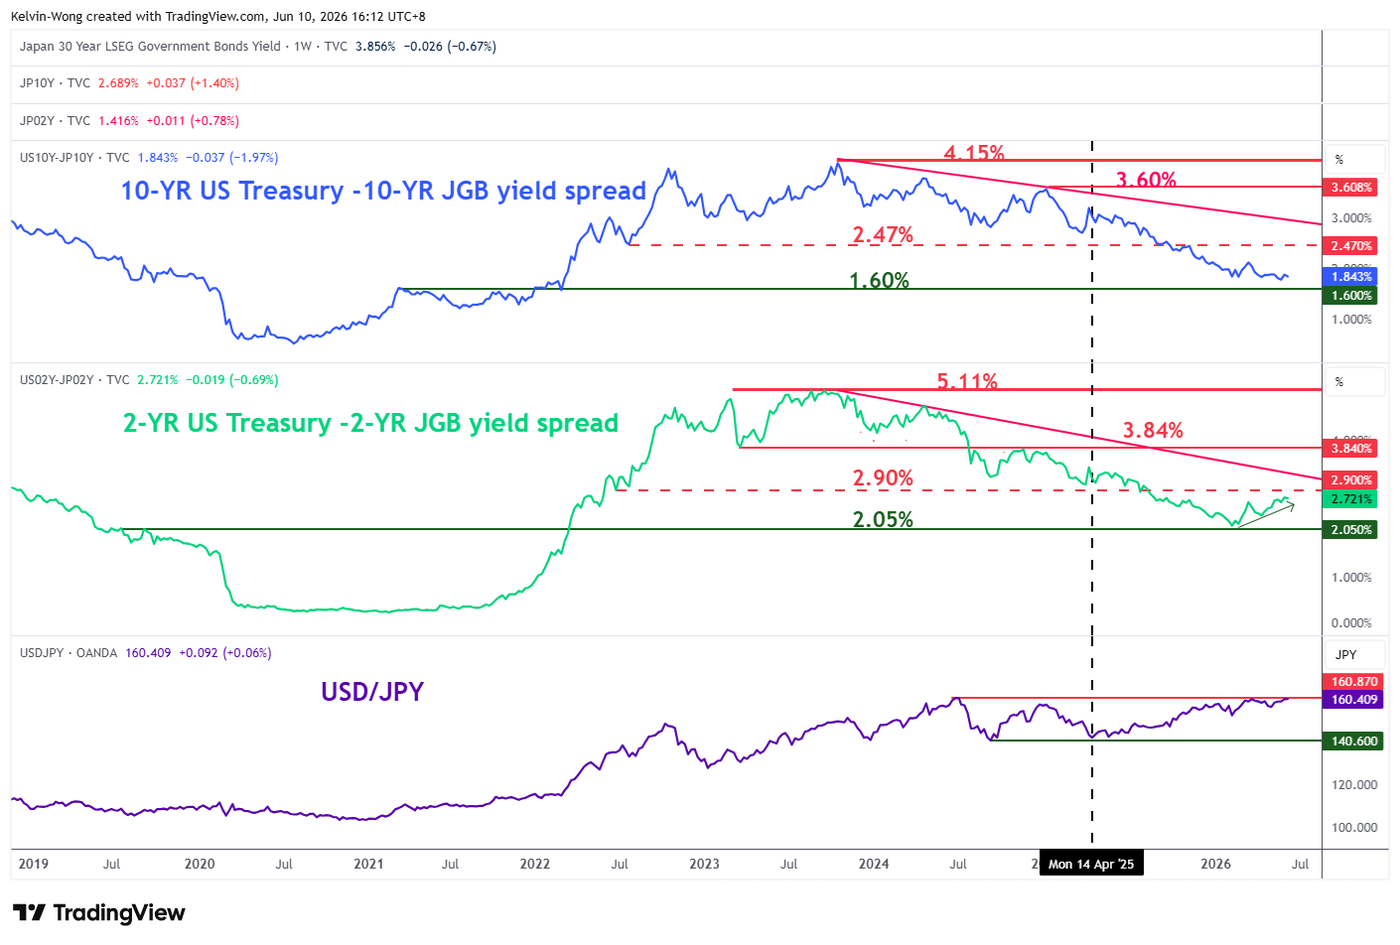
The short-term yield spread between two-year US Treasuries and Japanese Government Bonds (JGBs) has been widening since hitting a 4-year low of 2.12% earlier in February 2026, which is also just a slight hair above the key support level of 2.05% (see Figure 1).
The 2-year US Treasury yield spread has rebounded by 60 basis points to 2.72% as of Wednesday, June 9, 2026, meaning the US Federal Reserve is adopting a more hawkish monetary policy stance towards the Bank of Japan, which in turn puts downward pressure on the Japanese yen as it circles around the previous intervention zone at 160.40/70, with Deputy Finance Minister Mimura, in charge of foreign exchange, issuing a “final verbal ultimatum” to speculators in April 30, 2026 before the actual intervention takes place on the same day.
Japanese authorities spent a record $74.1 billion in the latest round of currency market intervention to buy the yen between April 30, 2026 and May 6, 2026, according to Finance Ministry data.
Let us now reveal the short-term path (one to three days) of the USD/JPY pair from a technical analysis perspective.
It is trending higher towards the upper “rising wedge” border at 160.60/95
Figure 2: Medium-term USD/JPY trend as of June 10, 2026 (Source: TradingView). The information provided is historical information, and past performance is not indicative of future performance.
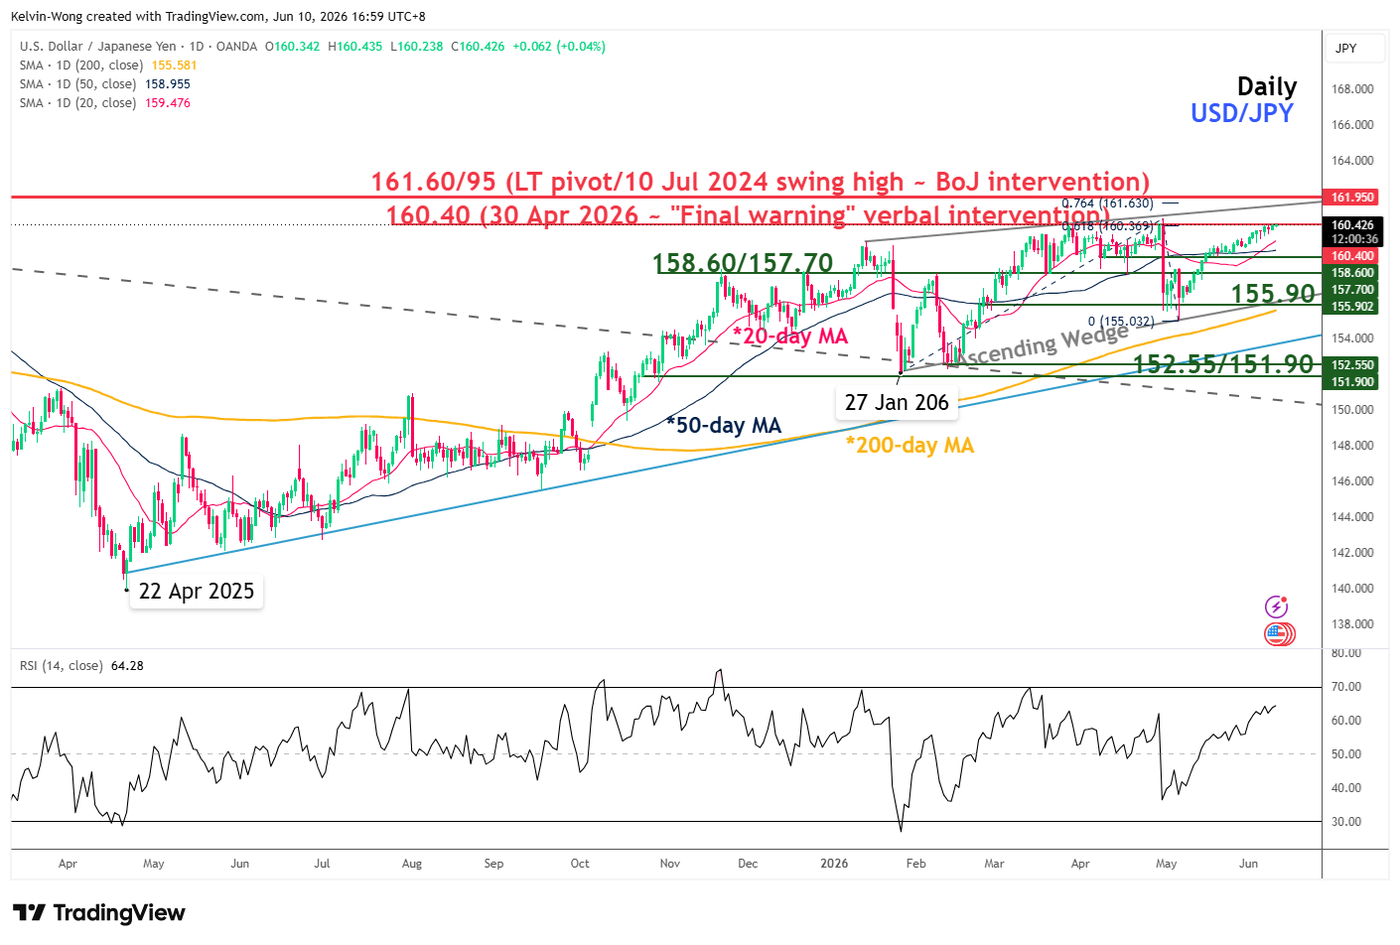
Figure 3: Secondary trend of USD/JPY as of June 10, 2026 (Source: TradingView). The information provided is historical information, and past performance is not indicative of future performance.
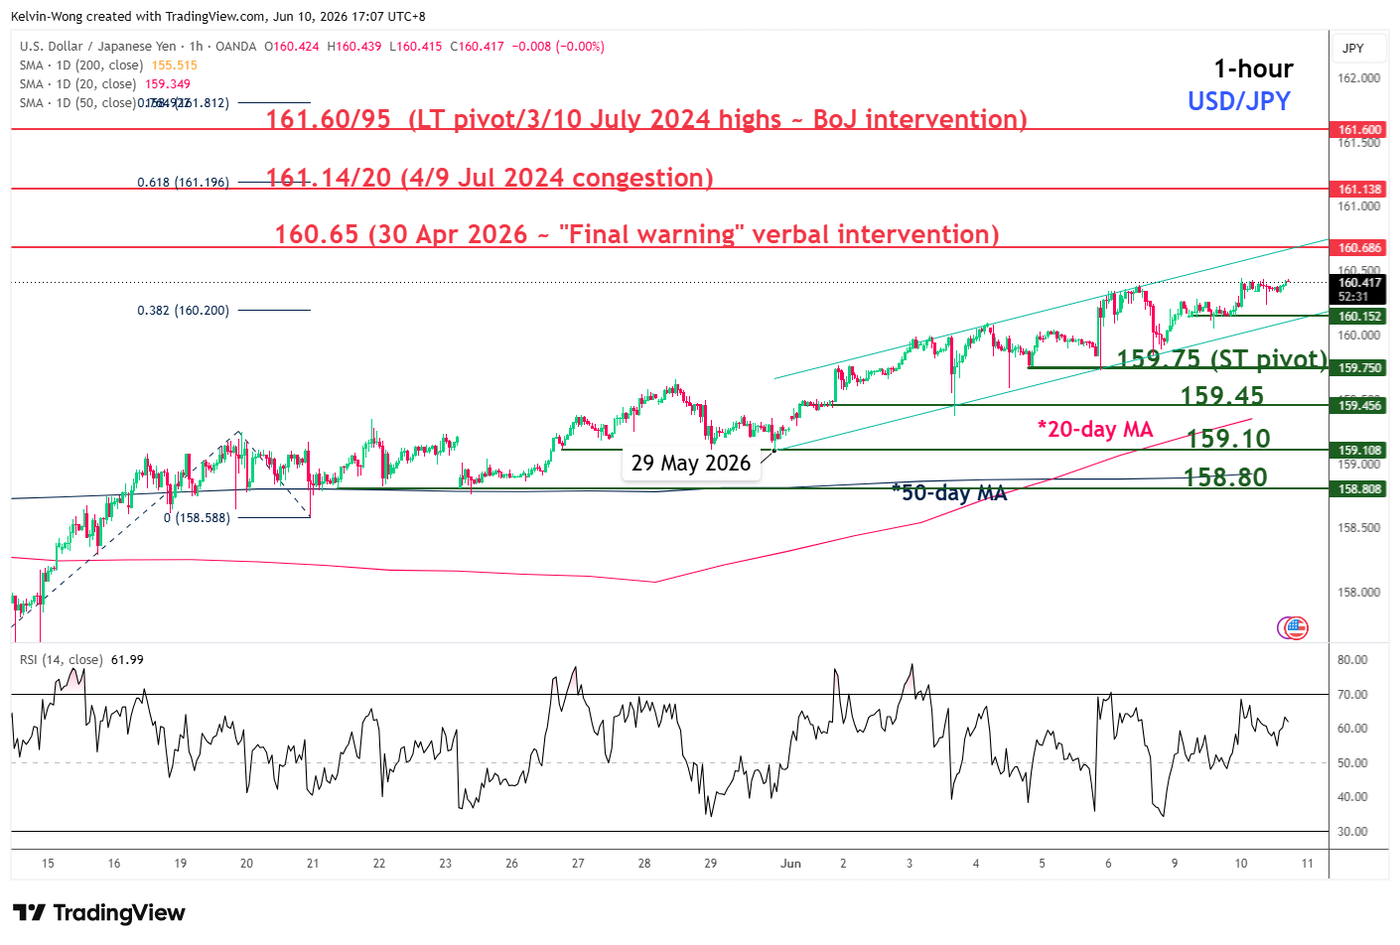
Directional bias: Minor uptrend with key short term support pivoted at 159.75.
Resistance: 160.65 (High April 30, 2026), 161.14/20 (4/9 July 2024 Fibonacci congestion and extension), 161.60/95 (long-term axis) (see Figure 3).
Supports the following: 159.45 (1/3 Jun 2026 congestion and 20 days MA), 159.10 (Low May 29, 2026), 158.80 (May 21/25, 2026 low and 50-day moving average).
Key elements to support the short-term uptrend of USD/JPY
- USD/JPY price action has been oscillating within a medium-term “rising wedge” formation since the low on January 27, 2026, with its upper bound at 161.60/95 (see Figure 2).
- The recent minor uptrend phase remains intact, as price action in USD/JPY continues to develop within a secondary uptrend channel in place as of the May 29, 2026 low at 159.10 (see Figure 3).
- The RSI momentum indicator remains bullish in the short term, holding above the 50 level (see Figure 3).


