

Bitcoin remains under intense selling pressure after breaking below the large upward channel that has been guiding the price action since February, and there appears to be little stopping the asset from falling.
The recent rejection from short-term resistance accelerated the bearish momentum once again and pushed BTC towards the key demand zone around $60K. Meanwhile, on-chain data suggests that long-term holders are making losses, reflecting a notable shift in market dynamics.
Bitcoin price analysis: daily chart
On the daily time frame, Bitcoin has decisively broken below the large ascending channel that has contained the price action for nearly four months. The breakout occurred after BTC failed to reclaim the confluence of the 200-day moving average and the $80,000 area and was rejected decisively to the downside.
The 100-day moving average located near the $72,000 area has now formed a major resistance area. The market tried to retest it after the initial collapse, but sellers quickly regained control and caused another decline before the market reached the area, where the price failed to break back above the short-term supply zone of $67,000. The rejection confirms that bears are still in control of the broader trend at the moment.
The asset is currently trading at around $63,000 and is hovering above a key support area at $60,000. This key demand zone represents the most important level on the chart, as it served as a launching pad for the recovery in February after the sharp capitulation move.
As long as Bitcoin remains below the broken channel and below the moving averages, rallies will likely be viewed as corrective. Furthermore, if the $60,000 support area fails to hold, the next important downside target appears to be the large $50,000-$52,000 demand zone. On the contrary, a recovery of the $72,000 resistance area will be required to negate the current bearish outlook and possibly reopen the way towards the $80,000 area.
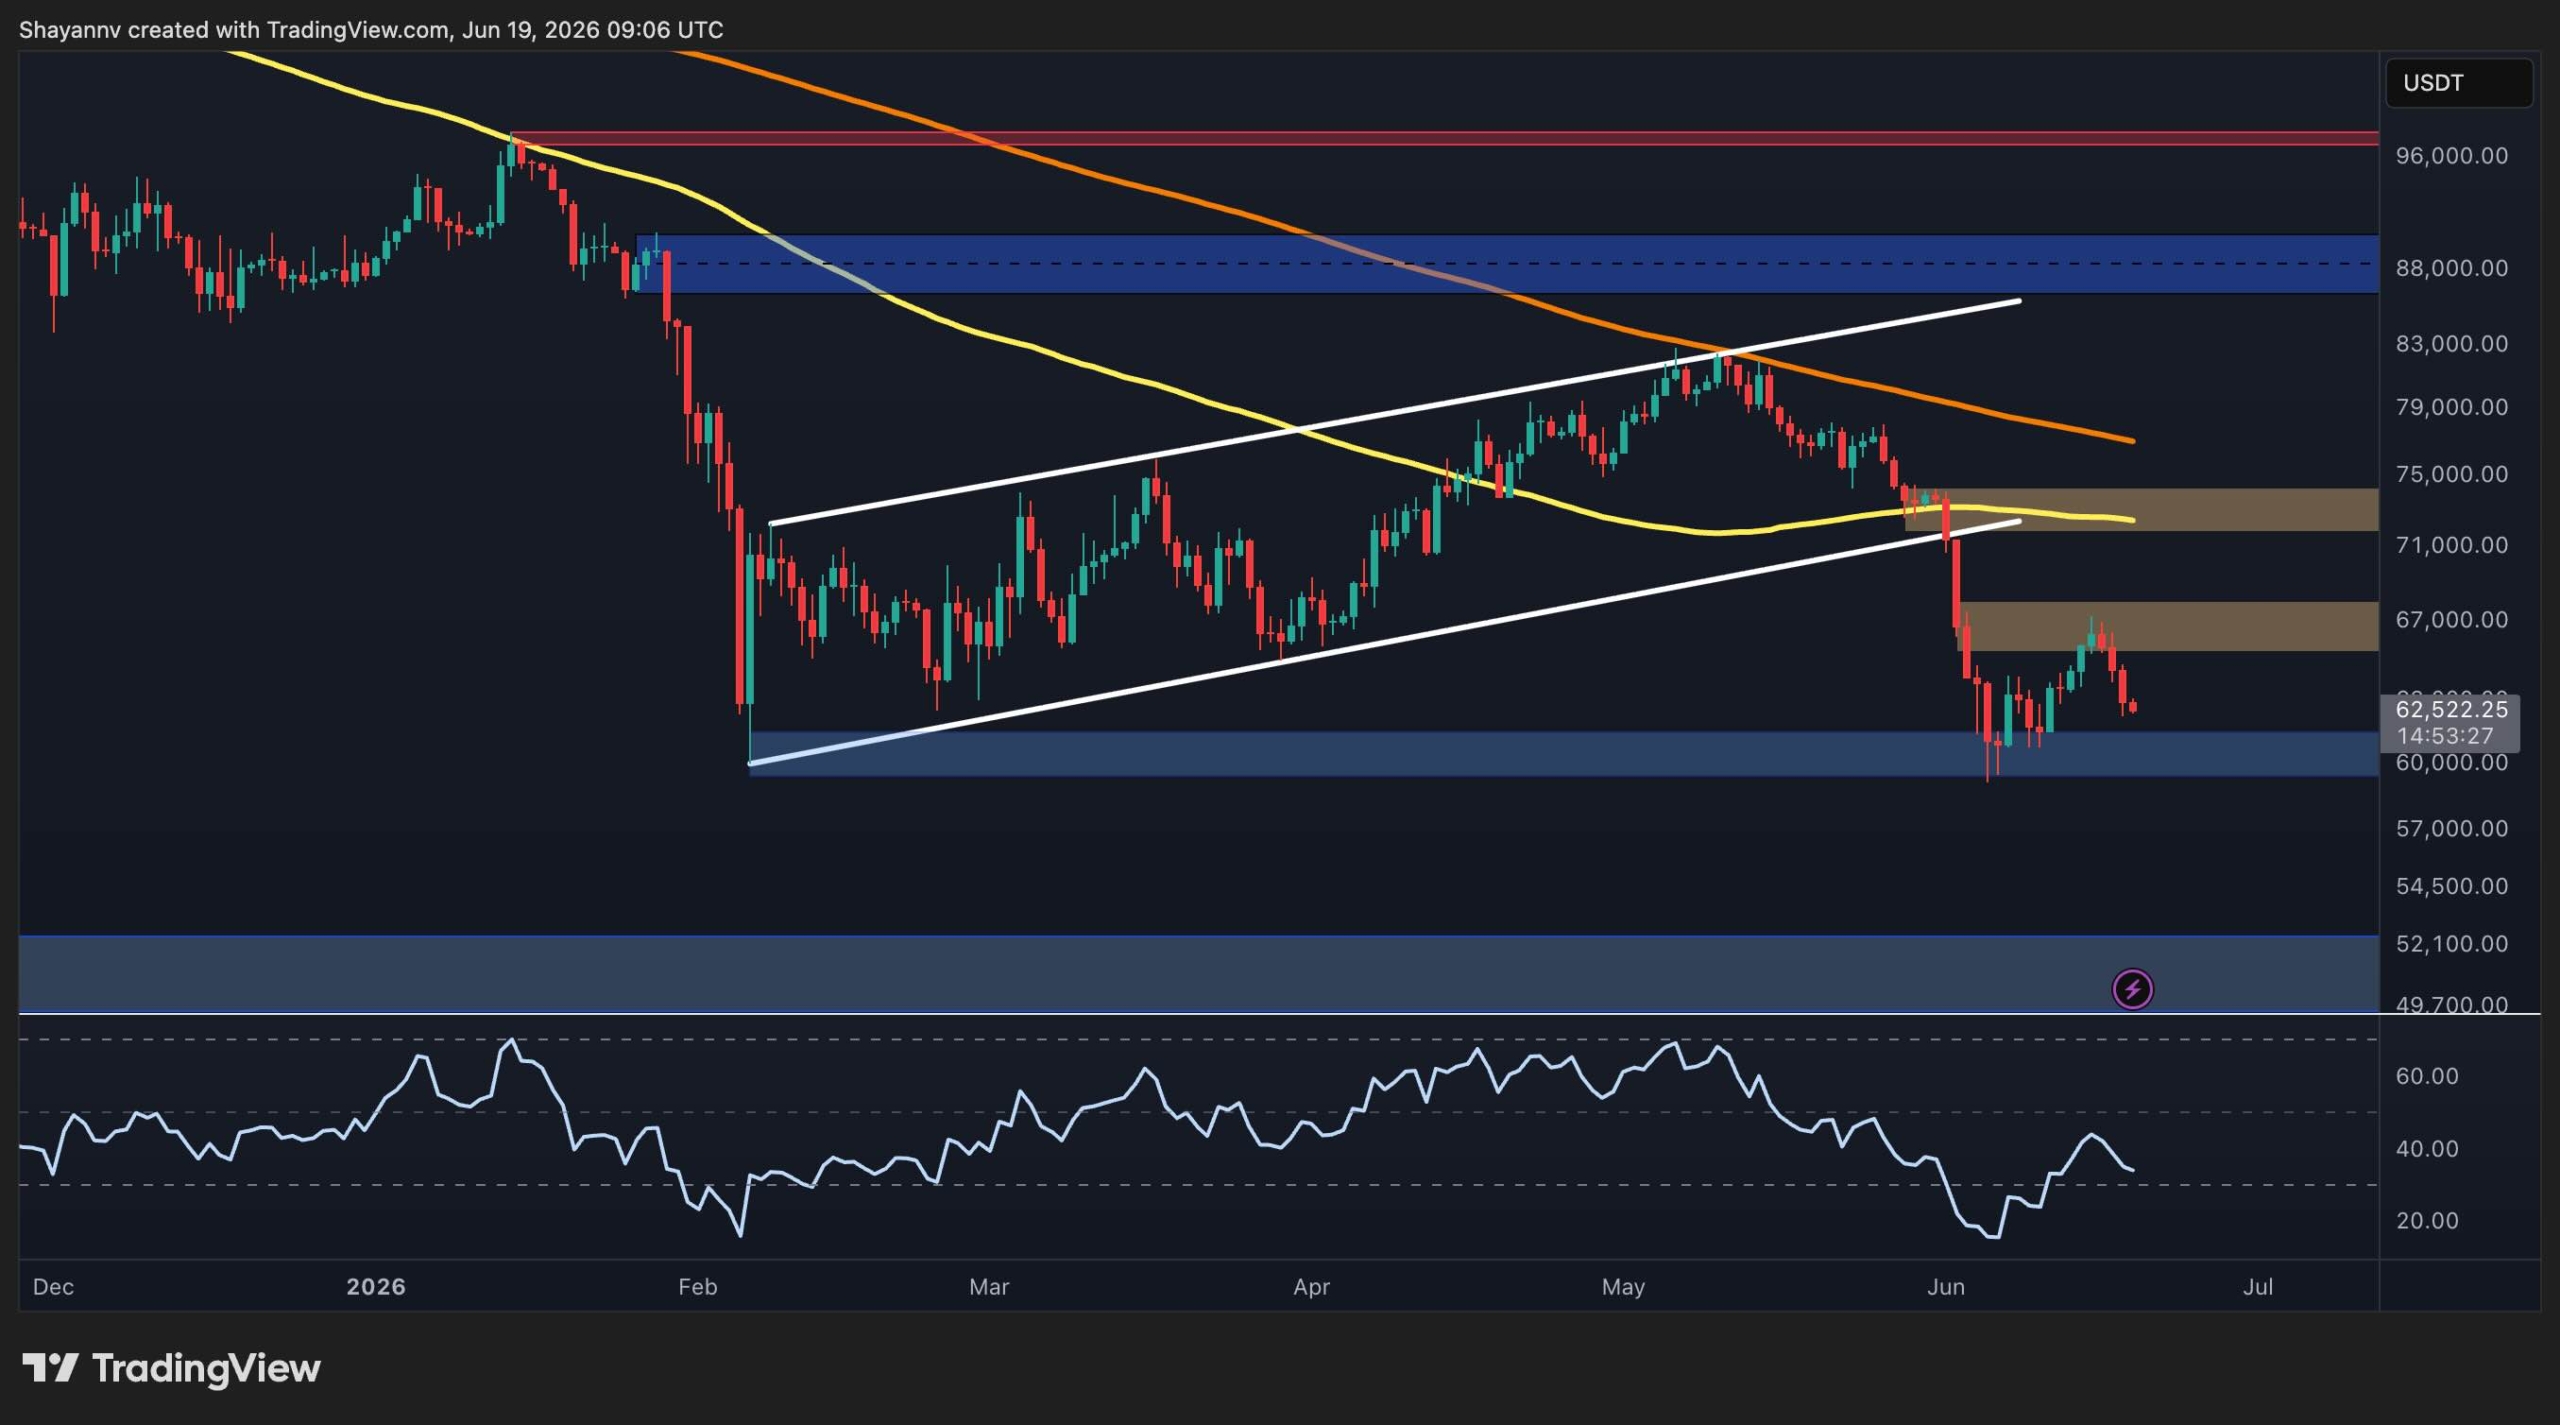
BTC/USDT 4-hour chart
The 4-hour time frame provides a clearer view of the recent breakdown. After breaking down from the $72,000 block to $74,000, BTC saw an intense sell-off that pushed the price to the $60,000 support zone. The subsequent bounce formed a short-term ascending channel, which is often considered a bearish continuation pattern when it develops after a strong decline.
The price recently fell below the lower border of the channel, confirming the bearish pattern and increasing the possibility of another test of the $60,000-$61,000 support area. The failed breakout attempt at $67K highlights the lack of bullish conviction. In addition, the RSI has moved out of nearly overbought conditions and is now trending lower near the oversold zone, indicating weak short-term momentum.
If sellers maintain control, immediate focus will remain on the $60,000 support area. A decisive breakout could trigger another wave of liquidation and accelerate the move towards higher liquidity pockets on the timeframe below the recent lows.
On the upside, Bitcoin will need to reclaim the $67,000 resistance area before any meaningful upside scenario can be considered. Above that, the next major barrier remains the $72,000 area, which corresponds to a broken daily support and moving average range.

On-chain analysis
The long-term bearer SOPR continues to trend sharply downward and is now below the critical 1.0 threshold. This metric measures whether long-term coin holders spend the coins at a profit or loss. Values above 1 indicate profitable spending, while readings near or below 1 indicate that coin holders are either making minimal profits or refusing to distribute their coins.
The continued decline in the 30-day moving average of the long-term SOPR holder reflects a significant decline in profit-taking activity among experienced market participants. Historically, such conditions often arise during prolonged corrections, where investors become less willing to sell after a significant decline.
The gauge recently reached the capitulation zone, and its continued deterioration confirms the weak market environment evident on the price charts. If the SOPR remains below 1, it will indicate that long-term bondholders are consistently making losses, a condition that has historically coincided with late correction phases and important market inflection points.
For now, the combination of bearish market structure, rejection of resistance, and poor long-term holder profitability suggests that Bitcoin remains vulnerable to further downside pressure unless buyers can reclaim the $72K area and regain control of the broader trend.

Free Binance $600 (CryptoPotato Exclusive): Use this link To register a new account and get an exclusive welcome offer of $600 on Binance (Full details).
Limited offer for Bybit’s CryptoPotato readers: Use this link To register and open a free position worth $500 on any currency!
Disclaimer: The information contained in CryptoPotato is that of the cited authors. They do not represent CryptoPotato’s opinions on buying, selling or holding any investments. We advise you to conduct your own research before making any investment decisions. Use of the information provided is at your own risk. See our disclaimer for more information.


