
The price of XRP was trading near $1.13 on June 22 after briefly falling to around $1.12 during the Sunday session.
summary
- XRP has rebounded from the $1.12 support level, but remains trapped between $1.10 and $1.30 this month.
- The MACD and RSI are showing improving momentum, although neither has confirmed a clearly strong bullish reversal.
- ETF flows and derivatives activity have improved, but continued spot demand still needs confirmation from buyers.
Buyers intervened near this level and pushed the token back towards $1.15 within hours, focusing on the lower end of the range.
The move kept XRP within the broad $1.10-$1.30 range that led the price action through most of June. The token is down more than 4% over the week and more than 13% over the past month, showing that the short-term recovery has not erased the broader weakness.
crypto.news data Show The 24-hour trading volume is close to $1.28 billion, with XRP ranking sixth in terms of market cap. Its market capitalization reached approximately $70.28 billion, while the fully diluted value remained above $113 billion. The circulating supply reached approximately 62.05 billion XRP out of a maximum supply of 100 billion tokens.
Testing support is important because XRP has already had difficulty maintaining higher levels this month. The previous move below $1.15 turned that area into the first resistance area. The bulls now need to reclaim $1.15, then $1.20, before a stronger recovery setup takes shape.
XRP indices are showing signs of early recovery
The MACD is showing a moderate bullish turn. The histogram is slightly positive near 0.0045, while the MACD line is located around -0.0379 and above the signal line near -0.0424. This setup indicates a weaker downside momentum and a short-term recovery attempt.
The signal remains early because both MACD lines are still below the zero line. This means that the momentum has not completely moved into bullish territory. XRP needs a stronger follow-through before traders can treat the setup as a confirmed reversal.
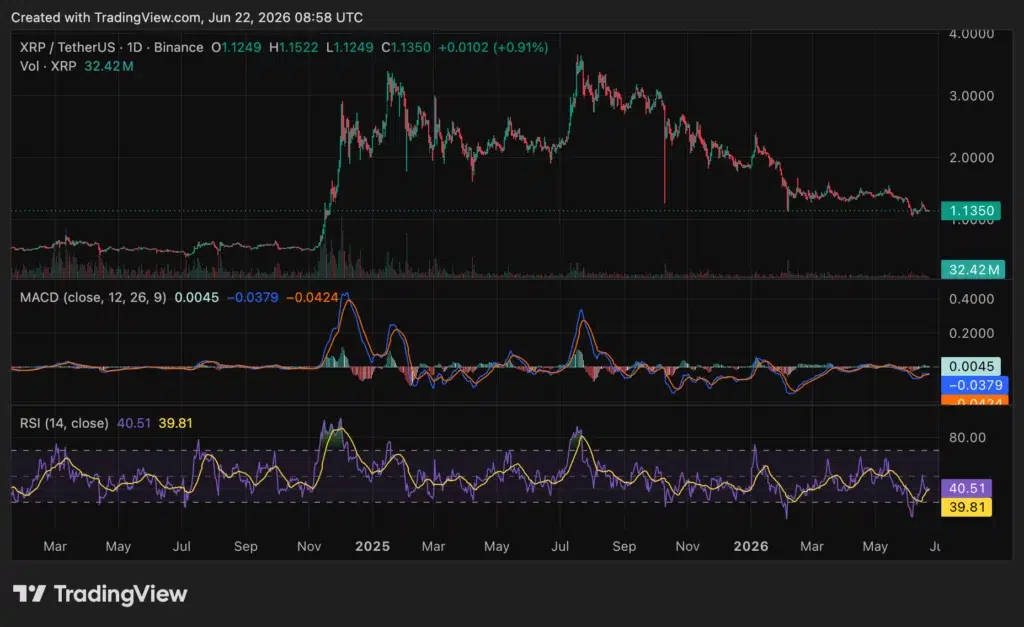
The Relative Strength Index stands near 40.51, just above its moving average of 39.81. This shows some improvement from weaker levels, but the reading is still below the neutral 50 mark. Purchasing power exists, but it is still limited.
A move above 50 on the RSI would give bulls a clearer technical signal. Until then, the chart still favors caution. The symbol is no longer showing heavy downward pressure, but it has not yet shown enough strength to confirm a new uptrend.
Improvement in flows and derivatives activity
Fund flows provide one of the most supportive signals for XRP. Ditto I mentionedXRP-related products recorded approximately $10.66 million in weekly net inflows for the week ending June 18. That was close to $10.68 million the previous week.
Cumulative net flows rose to about $1.45 billion, while total net assets approached $1 billion. These figures show that institutional-style demand has not disappeared, even with the spot price trading well below its highs last year.
Financial derivatives activity also increased. Coinglas data Show XRP volume rose 50.17% to $2.08 billion, while open interest increased 1.23% to $2.66 billion. The volume of options increased by 19.06% to about $609,170, and open options contracts increased by 0.75% to $65.47 million.
Higher volume and open interest can support sharper price movements, but they do not show trend on their own. If long positions are built while spot demand remains weak, volatility can rise on both sides. Traders will watch whether open interest grows with a price recovery or with another failed bounce.
Analysts are watching $1.36 and $1.08
Analysts are still divided on whether XRP is building a base or forming another stop within the downtrend. Javon Marks said the XRP breakout remains valid and maintains the measured long-term movement target near $17. He wrote that traders are anticipating another “>12X” move if the setup holds.
This goal remains an expectation, not a proven path. XRP will first need to clear several closer resistance levels, including $1.15, $1.20, and $1.30. The larger bullish case becomes more difficult to defend if the symbol loses the lower range.
Another analyst uses the name Batman He pointed out into a short-term compression phase. He said that XRP still has an upward demand trend line while downward resistance is pressuring the price action. He set the “breakout threshold” at $1.36 and the “invalidation” level at $1.08.
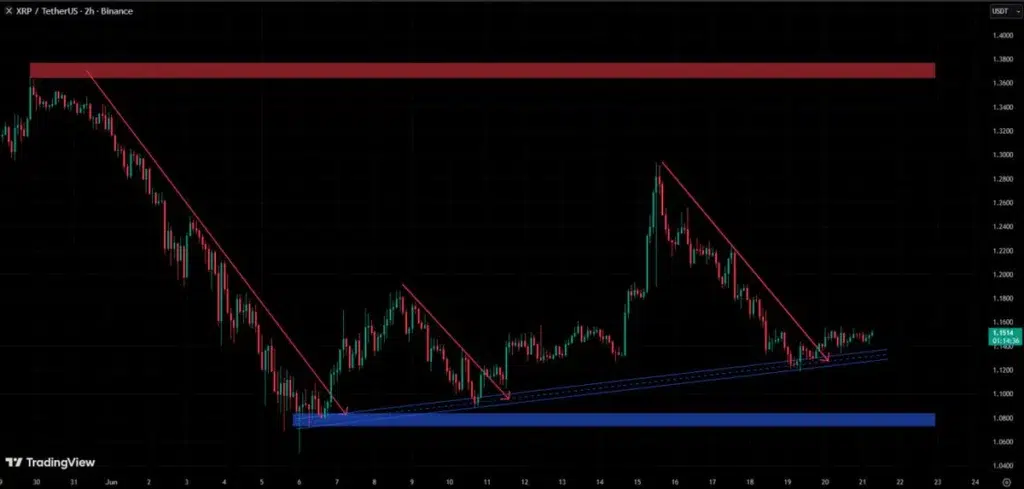
These levels give traders a clear map. A move above $1.36 indicates that buyers have taken control of the range. A loss of $1.08 would weaken the structure and could open the door to a deeper test of support.
At the moment, XRP’s position remains mixed. The token defended $1.12, flows improved, and the MACD turned slightly higher. At the same time, the RSI remains weak, the price remains below neutral momentum levels, and the broader trend has not recovered.
The next move depends on whether buyers can turn the bounce into a sustainable close above $1.15 and $1.20. If they fail, XRP may continue to move sideways near support. If the put proceeds are below $1.10, the $1.08 invalidation level could become the next test.
Disclosure: This article does not constitute investment advice. The content and materials contained on this page are for educational purposes only.


