

Quick overview
- HYPE has fallen 22% from its peak of $76.9, and is now hovering around $66.
- The critical support area between $50 and $54 coincides with the 50-day moving average
- Trader reaction decreased as open interest fell from $2.2 billion to $1.73 billion
- Spot market pressures are declining, although spot CVD remains negative at -$95 million
- Cryptocurrency analyst Altcoin Sherpa identifies $55-$64 as an attractive accumulation range targeting $100
Hyperliquid’s HYPE token saw a 22% decline from its all-time high of $76.9 achieved in recent trading sessions. Currently trading near $66, market participants are evaluating whether the bullish momentum that began in January remains intact.
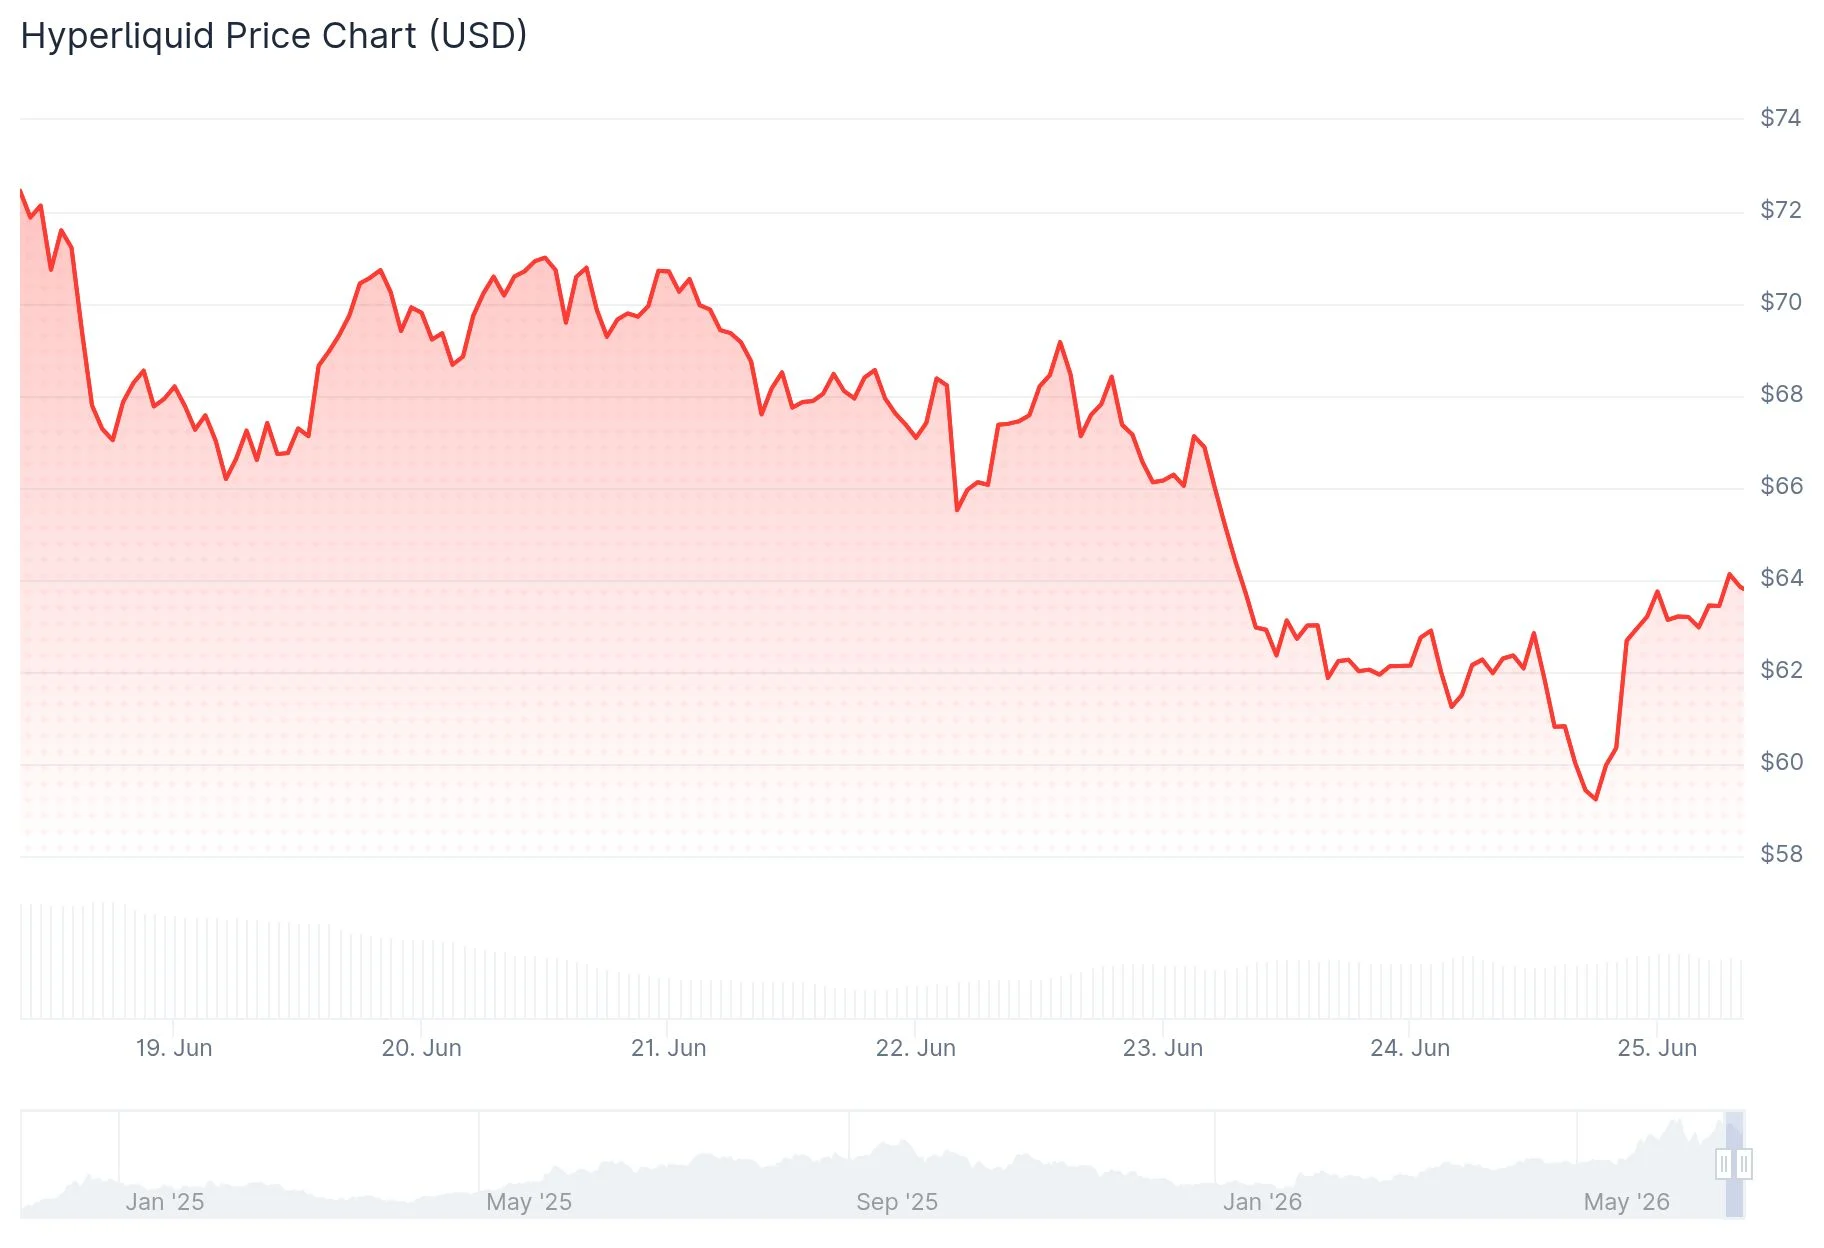
The correction emerged after the token failed to sustain levels above its record high near $76. During mid-week trading, HYPE fell below the $60 threshold before finding stability. The 50-day EMA, which provided consistent support during the rally that began in March, now faces a critical test.
Futures market metrics continue to reflect upbeat sentiment. Data from CoinGlass indicates a long to short ratio of 1.03, accompanied by positive funding rates of 0.0042%. This formation shows that long position holders are compensating for short sellers, indicating prevailing expectations for upward price movement.
Spot market pressure is showing signs of relief
Spot selling intensity has diminished compared to early June levels. Combined spot volume delta (CVD) has rebounded from recent lows, although it maintains a largely negative reading around -$95 million. When prices fell from $76 in early June, spot selling pressure peaked at $110 million.
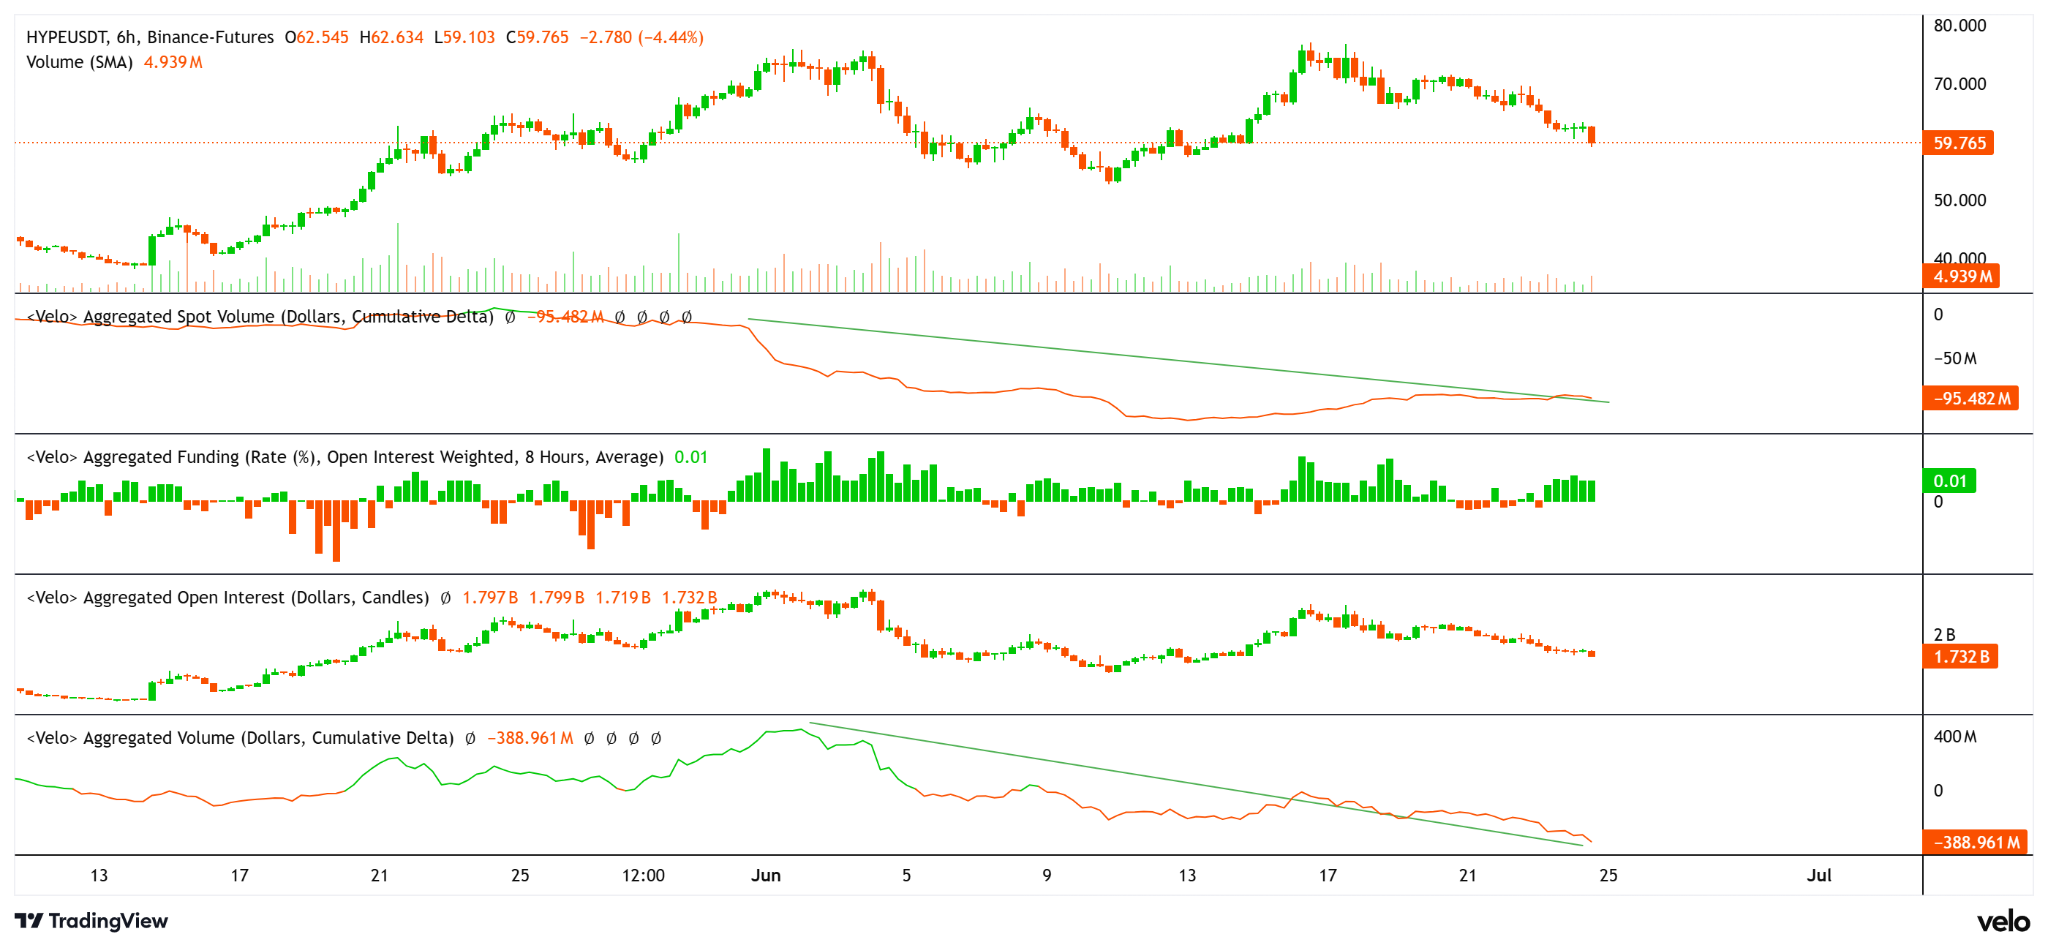
The derivatives scene tells a more conservative story. Open interest shrank from $2.2 billion to $1.73 billion. CVD derivatives are hovering near -$389 million. This indicates that market participants are reducing their positions rather than creating new trades.
Measures of social dominance The noise It has been declining since June 17, currently at 0.175% according to Santiment data. An increase in retail participation has emerged following all-time highs, which some market watchers interpret as a potential warning signal for short-term price movement.
ETF activity remained subdued throughout the week, with SoSoValue reporting minimal institutional participation.
The critical area between $50-54 appears as pivotal support
The most important support level appears between $50 and $54. This area is aligned with both the bullish 50-day EMA and the unfilled daily fair value gap. A daily candle close below $53 would mark the first bearish structural shift on the daily time frame of the year.
Below this level, the 100-day moving average at $51.57 represents subsequent support, followed by $49. There is more fundamental support around the $38 level.
Cryptocurrency analyst Altcoin Sherpa gave his view on the current market structure: “HYPE, I think anywhere in the 55-64 area is a very good place to accumulate this coin. I think it will hit $100 later this year personally and it is still the best altcoin… but it will also depend a lot on Bitcoin IMO.”
For a bullish continuation, a daily close above $74.60 would pave the way towards new highs. The 50-day EMA is currently at $58.94, the 100-day at $51.57, and the 200-day at $44.68, all of which lie below the current price action and indicate that the broader uptrend structure remains unbroken.
The RSI reads around 53 on the daily time frame, while the MACD displays marginal negative values, indicating that momentum has moderated without moving into bearish territory.


