

Key points
- SOL stock fell 1.7% but held steady above critical support areas as BTC and ETH ETFs saw capital withdrawals.
- US Spot Solana ETFs attracted $5.75 million in net capital during this time frame
- The volume of non-voting transactions exceeded one billion transactions on a weekly basis, which represents a historical precedent for the network
- Active wallet addresses jumped from 16.8 million to 29.7 million over 14 days
- The network ranked first among all tier 1 and tier 2 platforms in terms of dApp revenue and DEX trading volume
Solana (SOL) saw a 1.7% decline, holding near the $79-80 range throughout the latest tracking period, mirroring Bitcoin’s 1.65% decline. The broader cryptocurrency market cap shrank 1.47% to $2.14 trillion. However, SOL successfully defended critical support thresholds despite the bearish pressure.
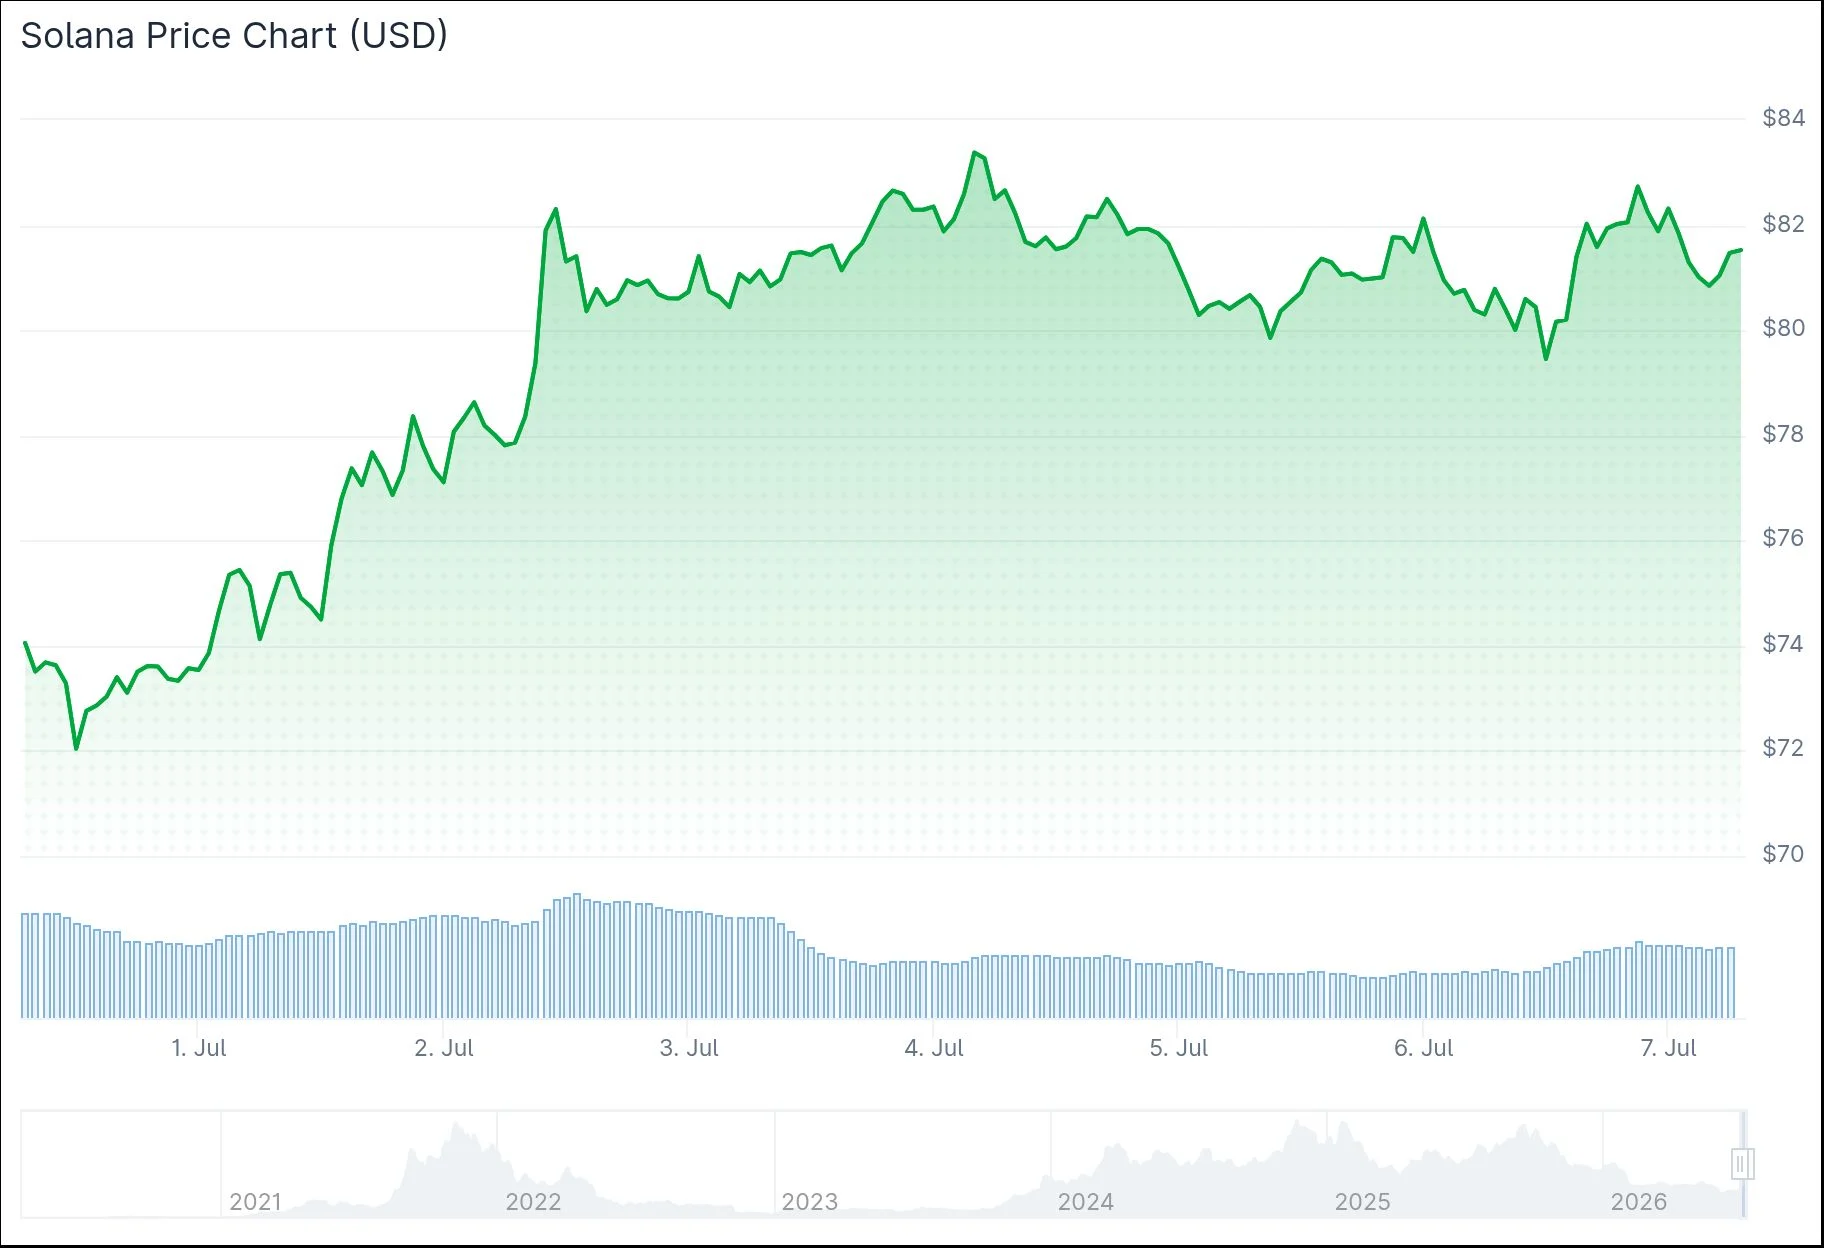
The digital asset remains about 73% below its record peak of $294.33 achieved on January 19, 2025.
A notable development this week centered on Solana’s mixed ETF performance compared to broader market trends. Spot Bitcoin ETF products recorded $527 million in net capital inflows from June 29 through July 2 – marking the eighth straight week of redemptions. The Spot Ethereum ETF lost $13.67 million during the same period.
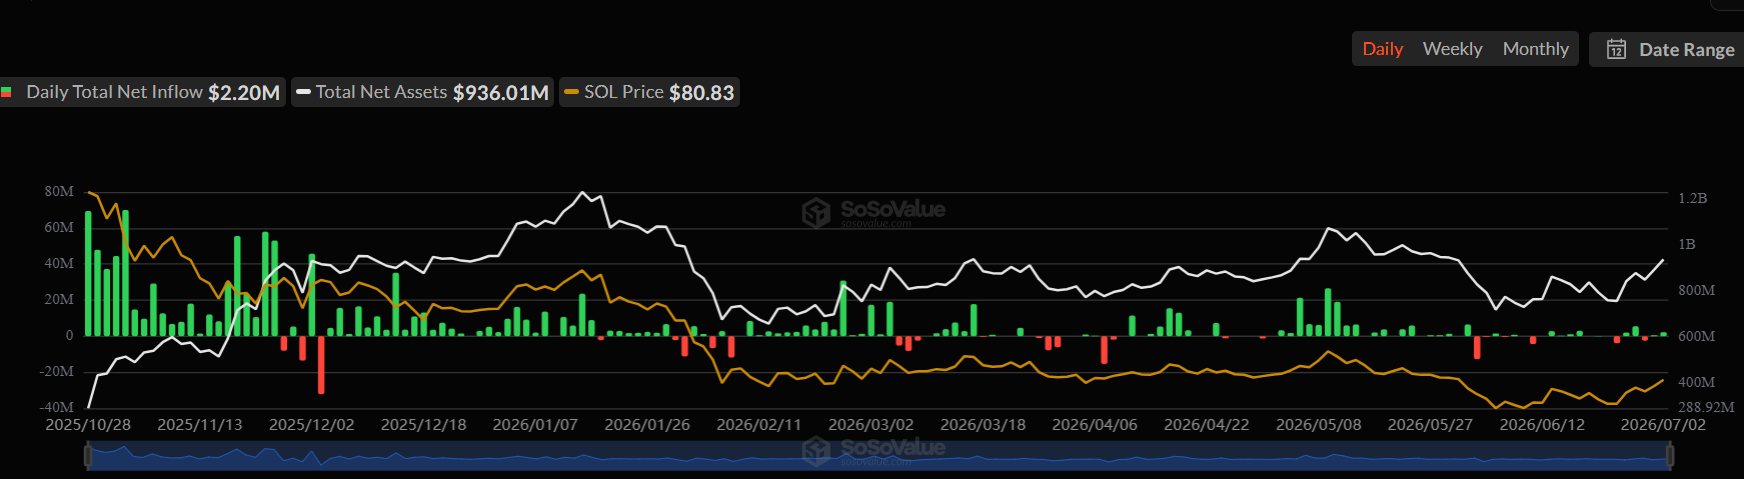
Solana showed opposite momentum. US-listed SOL spot ETF products accounted for $5.75 million in net capital inflows. The XRP ETF raised $17.19 million, while the HYPE ETF raised $4.32 million.
Network metrics are reaching unprecedented levels
Blockchain usage achieved a leading benchmark during the previous week. SolanaFloor verified that the number of weekly non-voting transactions exceeded one billion for the first time in the network’s existence. These transactions represent real user engagement, app interactions, and trades – excluding validator consensus votes – making this an important indicator of legitimate network activity.
Cryptocurrency analyst Michael van de Poppe provided a comment on Solana’s technical situation. He noted that the fundamental premise of USD SOL remains solid – the asset returns to its trading range with expectations of a minor bounce before bullish momentum resumes. He stressed the importance of maintaining the $75-77 level as key support, suggesting that a successful defense of these levels could push the move towards $100 and perhaps $120 over the coming weeks and months.
Active wallet addresses saw a significant expansion, rising from 16.8 million to 29.7 million over a two-week period – representing growth of approximately 76.8%. Additionally, Solana earned first-place rankings among all Tier 1 and Tier 2 blockchain platforms for both 24-hour and seven-day DApp revenue metrics, with DEX volume leading across the identical time frames. Polygon, Ethereum, Base, BNB Chain and Hyperliquid were all late.
Technical analysis shows coherence between key levels
With regard to trading activity, Solana It ranked second globally for the second week in a row, facilitating $12.25 billion across centralized and decentralized exchange platforms. This performance surpassed Bybit’s $10.57 billion, though Binance retained overall market leadership.
Examining the daily time frame, SOL is trading above the 20, 50 and 100 day moving average indicators. The MACD histogram maintains a bullish position, although momentum has slowed after the previous week’s 15% advance.
The RSI on the four-hour time frame recorded readings near 51-53, reflecting neutral trend momentum. The Supertrend indicator is below the current price action around $78.30. Near-term resistance clusters are at around $84 to $85, while support structures at $78 and $76 represent critical monitoring areas.
The last trading price at press time was around $80.34.