
Ethereum is still locked in a large-scale corrective structure. Price action shows continued hesitation rather than directional conviction, which seems fair given the escalation in the Middle East. Despite holding above the $1.8K support base, upward attempts are constantly being identified before any tangible trend shift develops.
Ethereum price analysis: daily chart
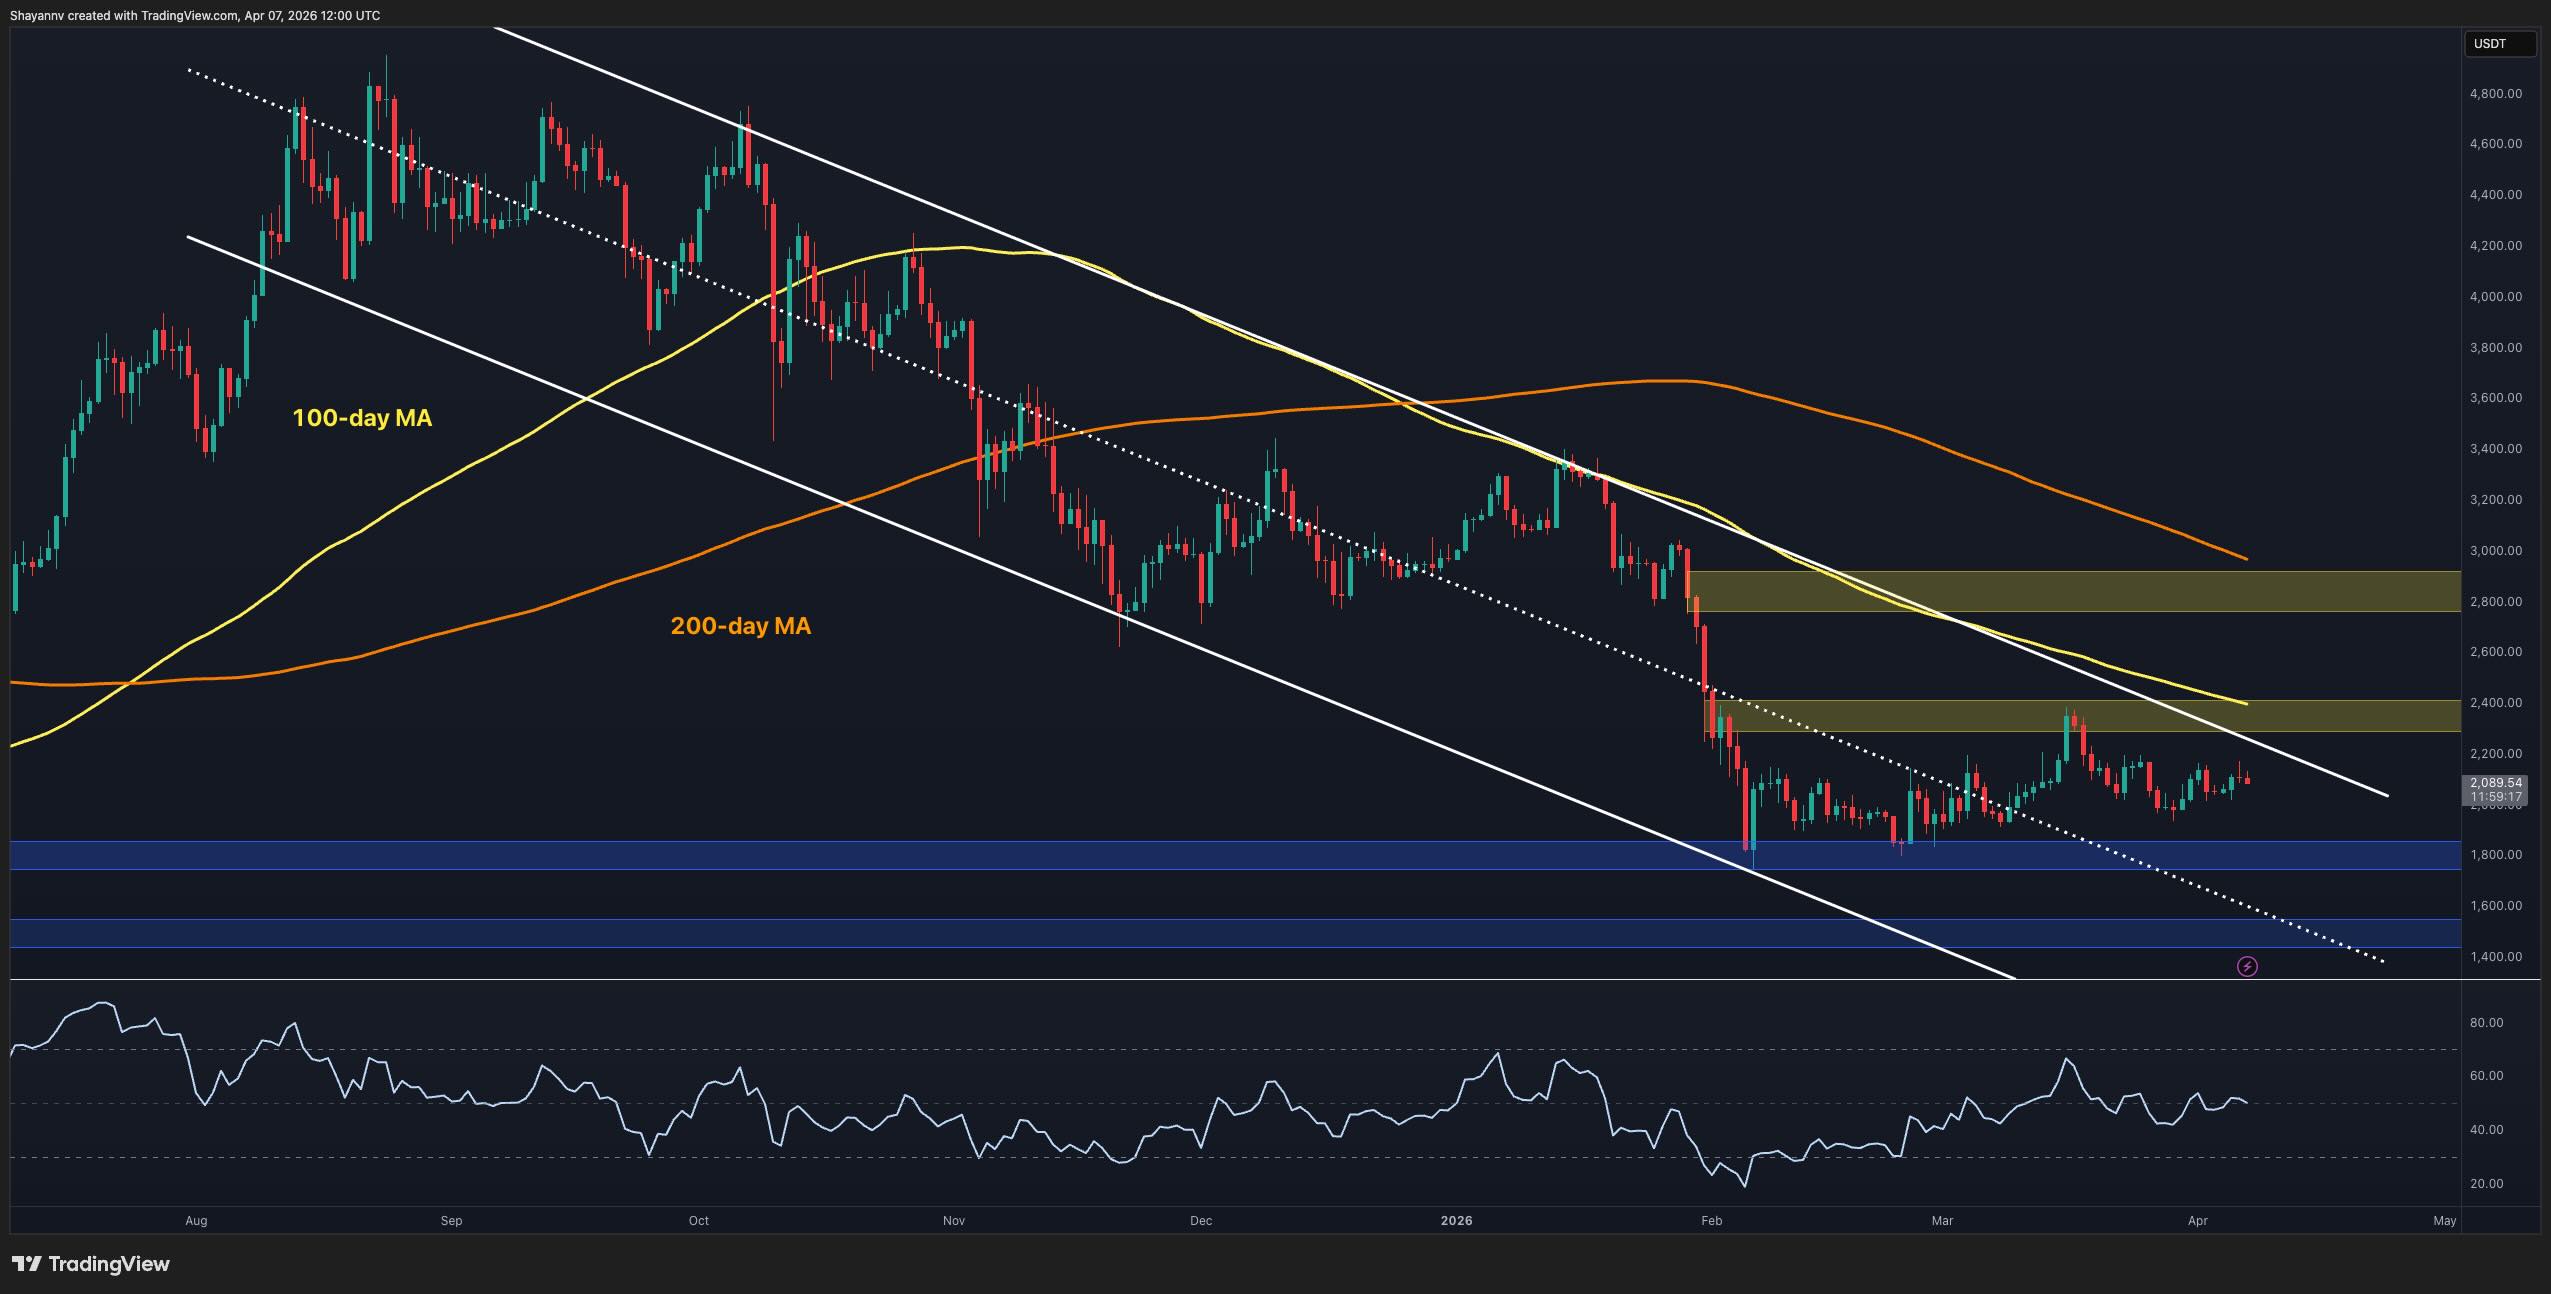
On the daily time frame, ETH is still trading within a large bearish channel. This confirms the broad bearish market structure that began in late 2025. The price is also still below the 100-day (~$2.4K) and 200-day (~$3K) moving averages, which continue the downtrend and act as dynamic resistance layers.
Currently, the $2.3K-$2.4K area is the key supply area. This area has rejected the price repeatedly and corresponds to the most recent bearish order block on the daily time frame. Meanwhile, the $1.8K area is acting as an important support area. This level has held several times, and as long as it holds, the downtrend remains confined within the current range.
A decisive break above $2.4K would nullify the sequence of lower highs and possibly shift the structure towards a bullish reversal, as it would also mean a break above the upper boundary of the descending channel and the 100-day moving average. Conversely, a loss of the $1.8K demand zone will likely trigger a range breakdown and open the door for a deeper move towards the next support level at $1.6K.

ETH/USDT 4-hour chart
On the 4-hour time frame, ETH is consolidating within a narrow triangle structure. This pattern is defined by a rising trend line from the lows at $1.8K and major horizontal resistance around $2.4K.
The price is currently trading at around $2.1K. It repeatedly tested the short-term $2.2K resistance area formed with the recent 4-hour highs, but failed to break it with conviction. With the lower trend line of the triangle also converging from below, the structure indicates pressure, and a breakout becomes increasingly likely.
If buyers can turn $2.2K into support, the next move will likely target the key supply area of $2.4K. However, a failure to break higher and a loss of the uptrend line would shift the momentum downward, exposing the $1.8K support area in the coming weeks.

Sentiment analysis
The buy/sell ratio is currently rising and has shown consistent readings above 1 over the past month. This indicates that aggressive buyers are becoming more active in the market.
However, this increase in borrower buying pressure is occurring within a downtrend and broader range environment. Historically, similar spikes have often appeared near local peaks or during short-term relief rallies, rather than signaling the beginning of sustained uptrends.
This suggests that although sentiment is improving in the short term, it may be driven more by speculative positions than strong spot demand. As a result, if the price fails to break the $2.4K resistance level soon, the buildup of aggressive long trades may decline, resulting in significant downside volatility, which could prolong the overall downtrend.

Free Binance $600 (CryptoPotato Exclusive): Use this link To register a new account and get an exclusive welcome offer of $600 on Binance (Full details).
Limited offer for Bybit’s CryptoPotato readers: Use this link To register and open a free position worth $500 on any currency!
Disclaimer: The information contained in CryptoPotato is that of the cited authors. They do not represent CryptoPotato’s opinions on buying, selling or holding any investments. We advise you to conduct your own research before making any investment decisions. Use of the information provided is at your own risk. See our disclaimer for more information.


