
Bitcoin fell toward $65,700 after approaching $67,000, as caution ahead of Alphabet’s earnings and a sharp rise in oil pushed traders away from risky assets.
summary
- Bitcoin price fell below $66,000, as uncertainty over tech earnings and rising oil prices weighed on sentiment.
- ETF flows remained positive, while Bitcoin faced a major test of market structure near $66,950.
- A loss of $64,992 could expose deeper support, while a breakout could lead to liquidations towards $68,000.
According to data from crypto.news, Bitcoin (Bitcoin) The price was trading near $65,970 at press time, down about 1.5% on the daily chart after hitting an intraday high of $66,886. The decline came Recovery for several days from July lows near $58,000, but traders remained reluctant to chase the move before big tech companies reported their quarterly results.
US stock futures fell on Wednesday as investors awaited results from Alphabet and Tesla. Alphabet is facing particular scrutiny because Wall Street wants proof that its huge spending on artificial intelligence can deliver lasting returns. Analysts expect the company’s annual capital spending to reach between $180 billion and $190 billion, according to Reuters.
Semiconductor stocks also saw sharp fluctuations on concerns that technology companies may limit spending on artificial intelligence infrastructure. Weakness in chipmakers could put pressure on the Nasdaq and drain demand for Bitcoin, which has maintained a strong short-term correlation with high-growth stocks during periods of market stress.
Meanwhile, US bitcoin exchange-traded funds recorded $203.2 million in net inflows on July 21, according to Data Compiled by Farside Investors. BlackRock’s IBIT advanced $163.9 million, while Fidelity’s FBTC added $23.1 million. The total fell from $226.8 million in the previous session, leaving institutional demand positive but not enough to push Bitcoin to the June high.
Bitcoin price needs a daily close above $67,000
Bitcoin’s four-hour chart puts $66,950 at the top of the recovery range that started from the July 1 low of $57,799. Buyers briefly approached that limit on Tuesday before profit-taking sent the price below $66,000.
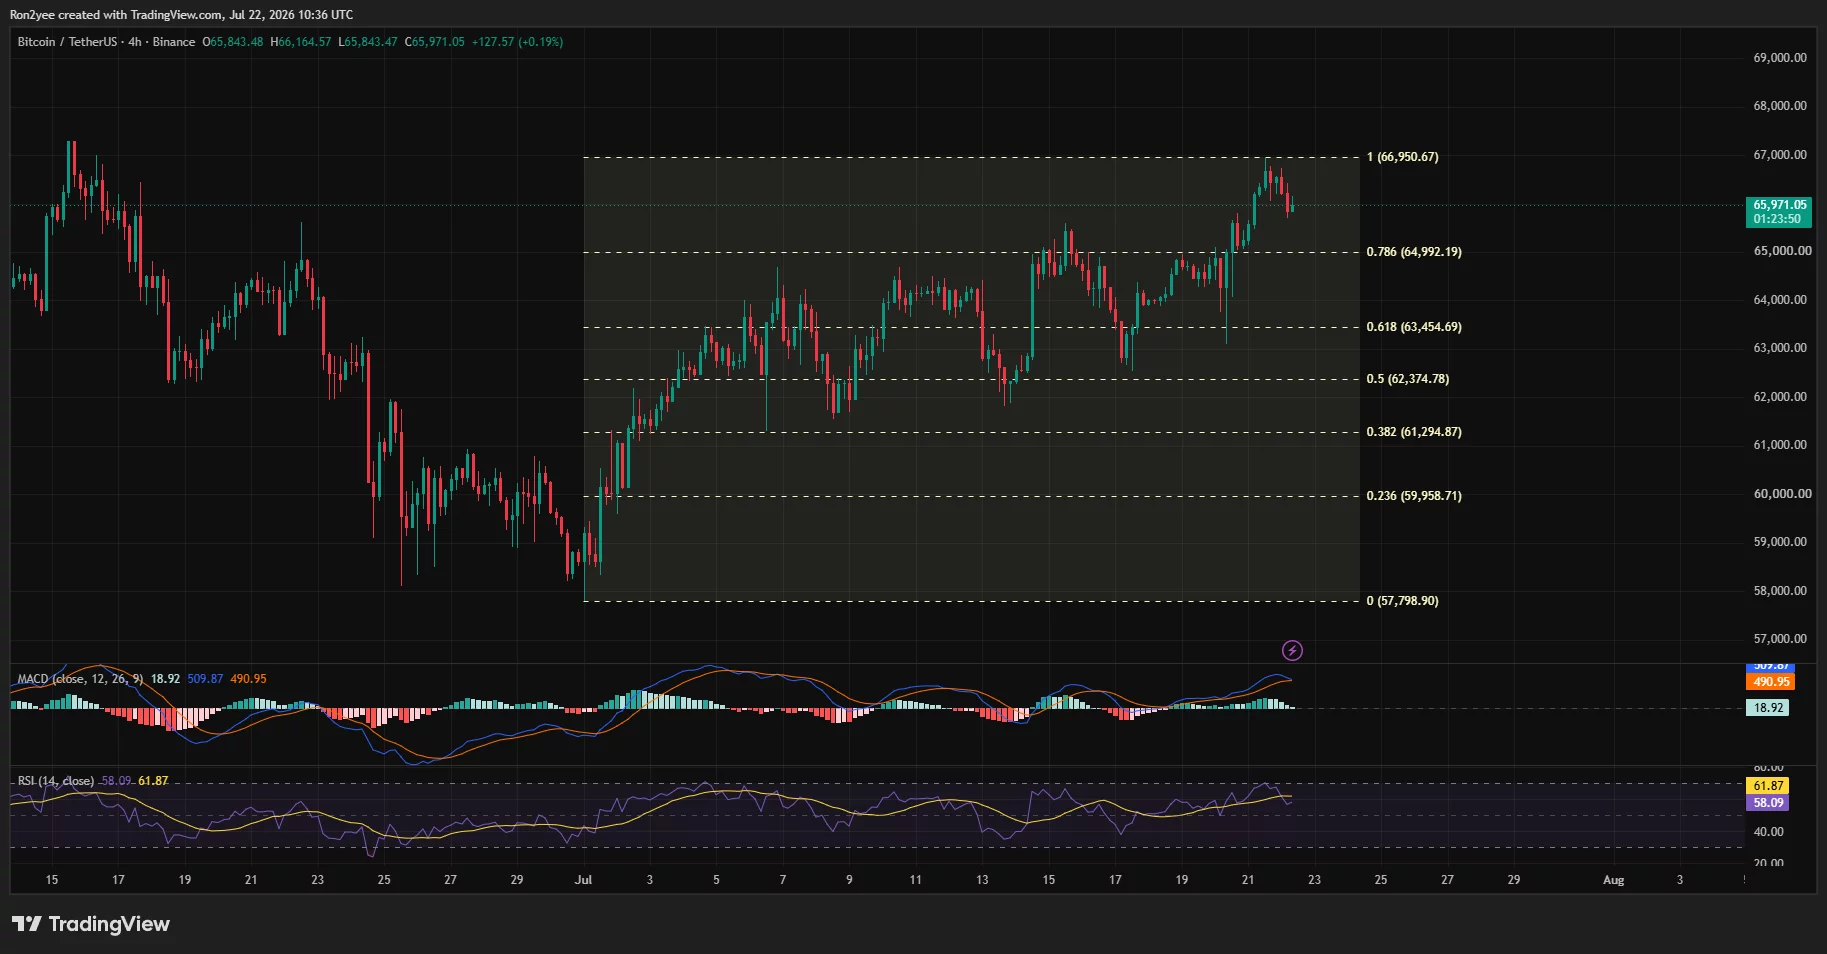
A confirmed close above $66,950 would produce Bitcoin’s first higher daily high since the May high and could turn $67,000 into support. According to trader Daan Crypto Trades, a break above the June high would create a “daily breakout of a bullish market structure,” opening the way to higher levels.
The daily chart provides another constructive signal. BTC remains above the 20-day and 50-day simple moving averages at $64,065 and $63,135, respectively. These averages now form the first dynamic support area, while the Chaikin Capital Flows reading of 0.13 shows that capital inflows exceeded outflows during the recent recovery period.
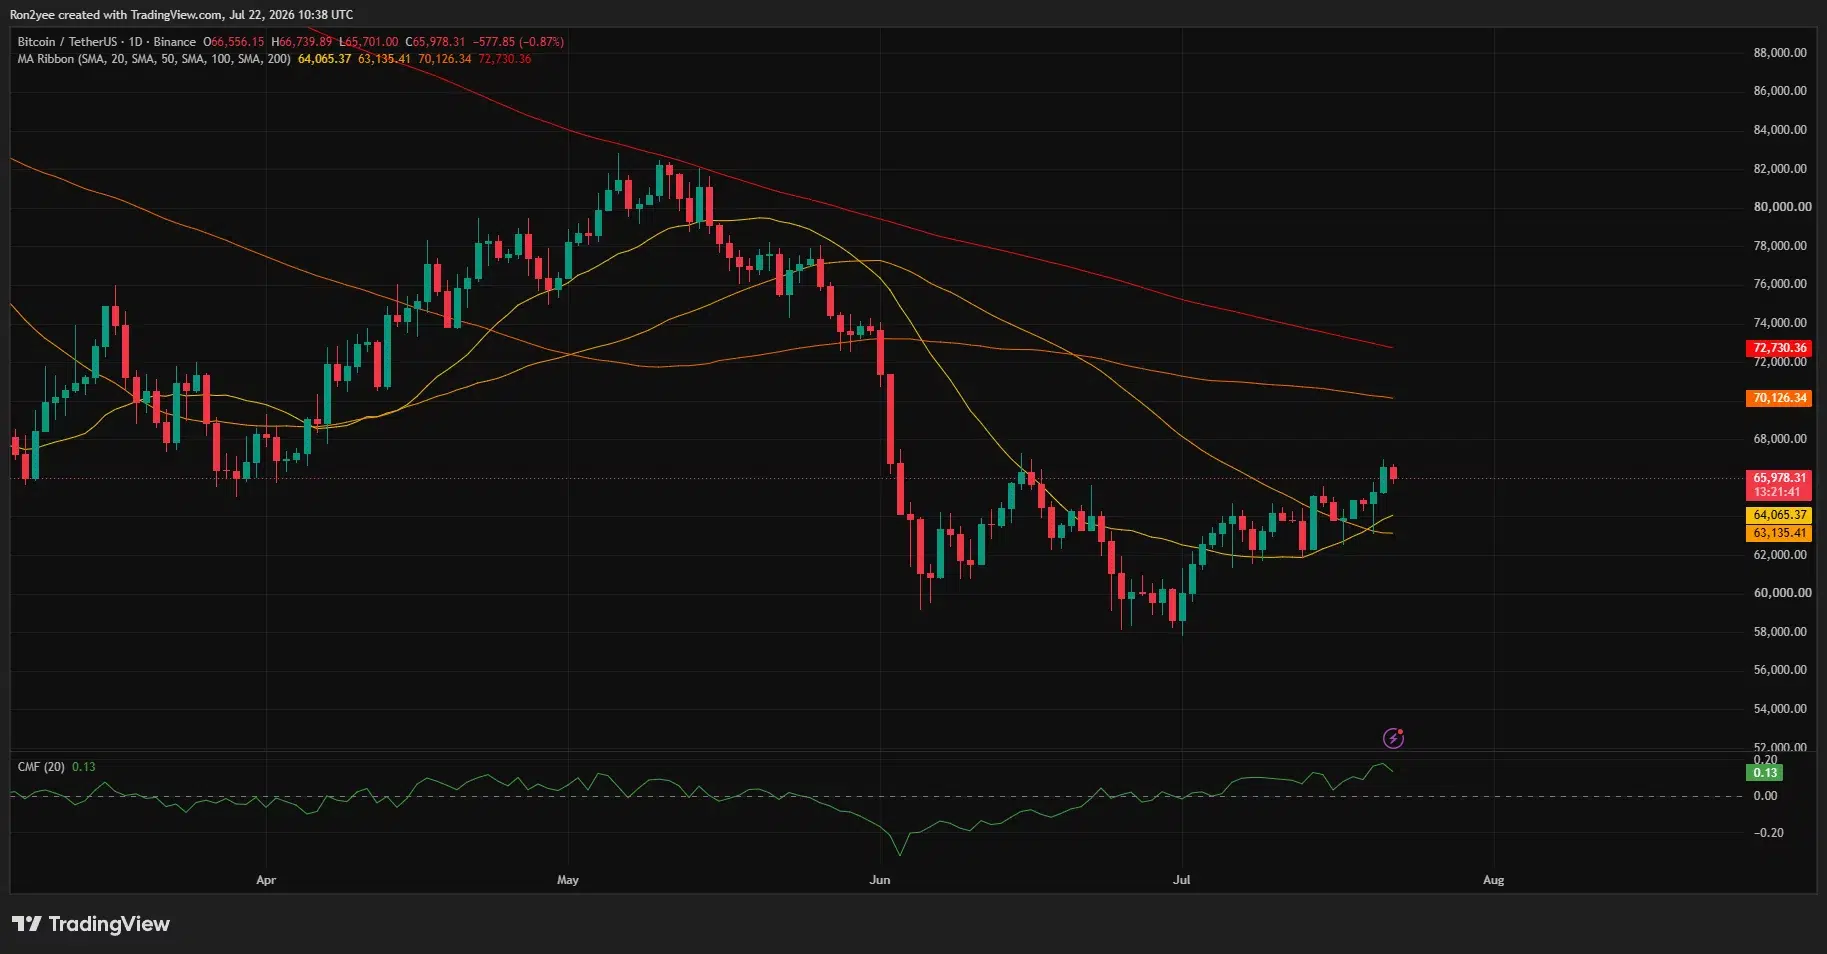
Long-term resistance is still much higher. Bitcoin is trading below the 100-day simple moving average at $70,126 and the 200-day simple moving average at $72,730, which means the daily trend has not completely reversed. A sustained move above those averages would expose the $76,000 area and reduce the impact of the decline from the May peak near $82,000.
Analyst Ted Pillows too male Bitcoin’s daily supertrend has flipped from bearish to bullish. Comparing the setting to the previous reference, Bellows wrote:
“It pumped the last Bitcoin by ~15% in 4 weeks. A similar pump means Bitcoin will reach $76,000 by August.”
The momentum is still positive, but it lost some strength after the rejection. The four-hour RSI fell to 58.09 from above 60, keeping Bitcoin out of the overbought zone. The MACD remains above its signal line, although the positive shrinking histogram shows that buyers have reduced the pace of accumulation.
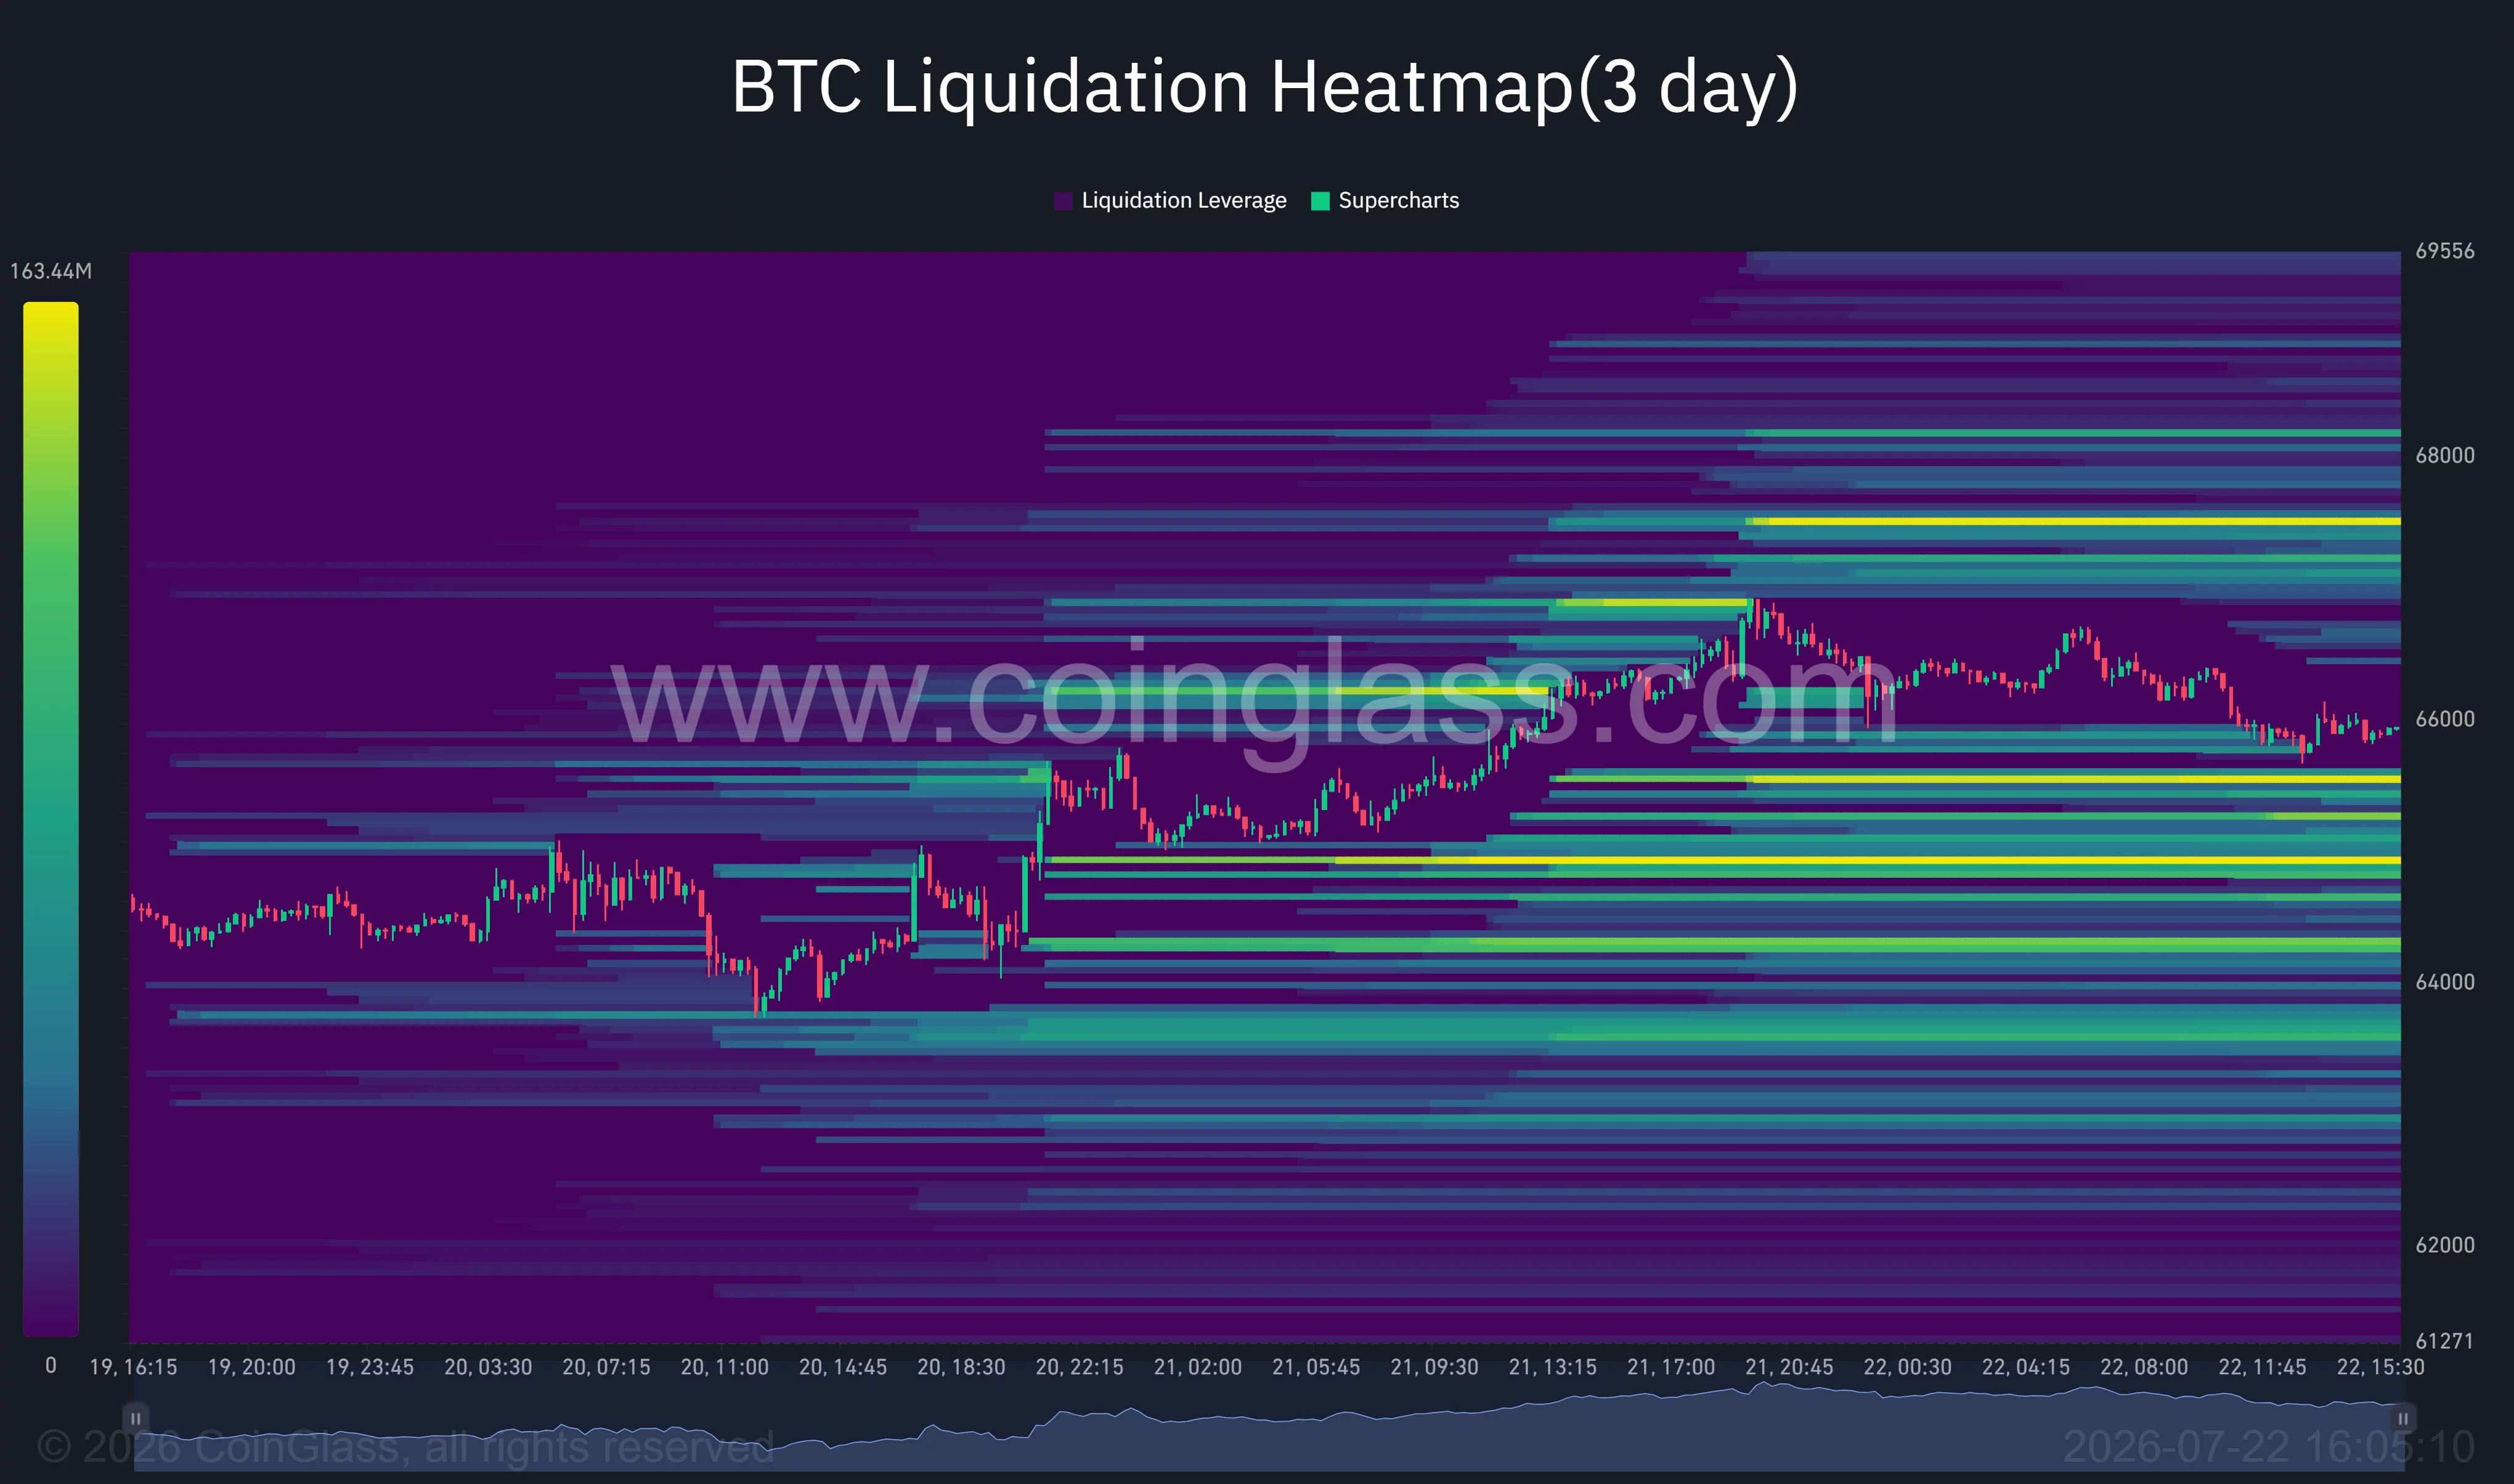
CoinGlass’ three-day liquidation heat map places the largest nearby short liquidation cluster at around $67,300, with another dense range near $68,000. A move through the $66,950 level could force leveraged sellers to close their positions and provide the momentum needed to test both areas. On the downside, long liquidation groups are located near $65,500, $64,700, and $64,300.
Oil and Fed risks threaten economic recovery
West Texas Intermediate crude rose more than 4% to $87.99 on Wednesday, while Brent crude rose above $94, after escalating tensions between the United States and Iran raised concerns about supply routes. President Donald Trump refused to hold immediate negotiations with Tehran He threatened further action Against the suspected nuclear facility at Mount Picax. Houthi threats against shipping have increased the risks around the Red Sea and Bab al-Mandab Strait.
Higher energy costs may prolong inflation and constrain the Federal Reserve’s ability to support markets. A July poll showed that economists expect the Fed to keep interest rates at 3.50%-3.75% through 2026, although more respondents now see a high chance of an increase. Higher oil prices and higher Treasury yields would increase the hurdle for speculative assets like Bitcoin.
A 4-hour close below the 78.6% Fibonacci level at $64,992 would weaken the current recovery and expose $63,455, followed by $62,375. Missing the daily moving average set near $63,100 would invalidate the immediate bullish setup and could take Bitcoin back to $61,295.
For the bullish case to remain intact, Bitcoin must defend the $65,000 level and close decisively above $66,950. Until then, oil prices, Alphabet’s earnings, and leveraged positions leave BTC vulnerable to another liquidity sweep below the current range.
Disclosure: This article does not constitute investment advice. The content and materials contained on this page are for educational purposes only.