
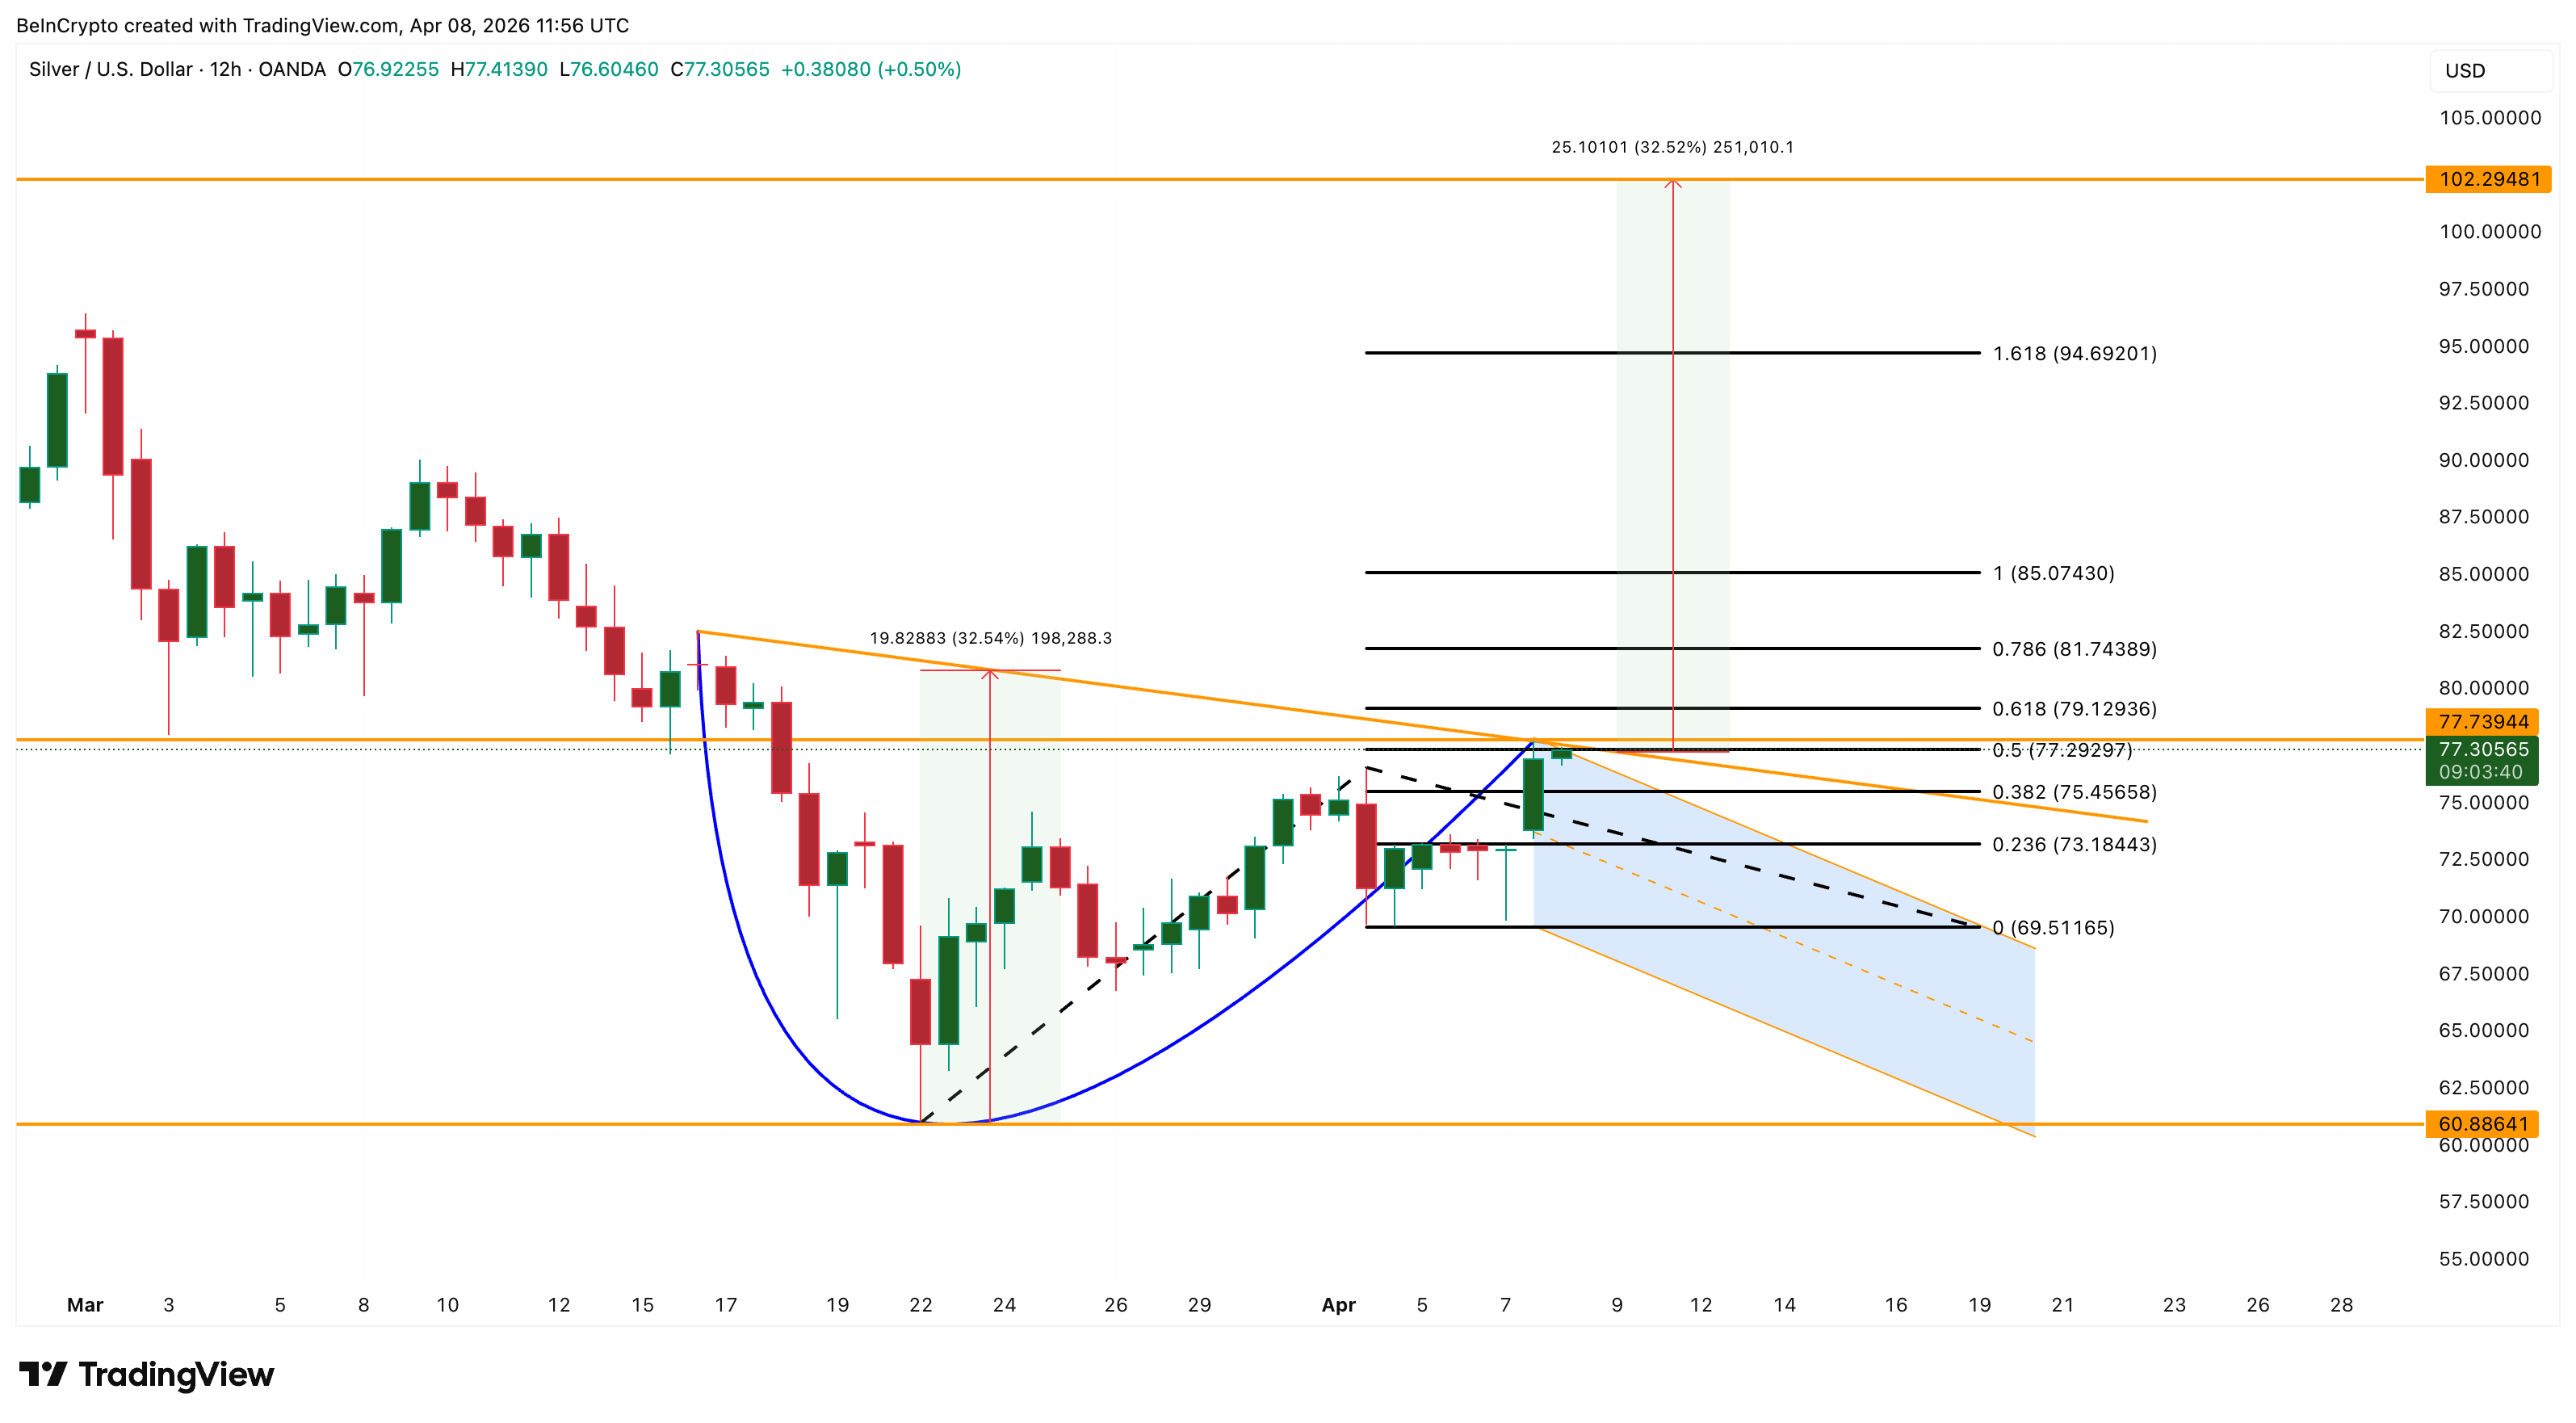
Silver price (XAG/USD) is trading at $77.31 on April 8, forming a cup pattern on the 12-hour chart with a 32% breakout expected that puts three figures within the range.
The setup comes as the US-Iran ceasefire has seen Brent crude collapse by 15%, sending the US Dollar Index (DXY) down 1.63% from its high on April 6. A weak dollar usually raises the price of silver because the metal becomes cheaper for foreign buyers. Whether this macro tailwind translates into a confirmed breakout depends on how the handle forms and whether the futures market agrees.
Silver price is building a cup with the RSI forming the handle
Silver price It has been forming a cup pattern on the 12-hour chart since mid-March. The rounded bottom took shape during the late March correction, and now the latest bounce has completed the supposed cup. All that’s left is the handle, and a small pullback from the recent peak at $77.73 points to this formation.
The Relative Strength Index (RSI), a momentum indicator that measures the speed of price changes, raises the handle condition. Between March 9 and April 7, the price made a lower high while the RSI made a higher high. This is a hidden bearish divergence, indicating that the current pullback from the neckline may continue.
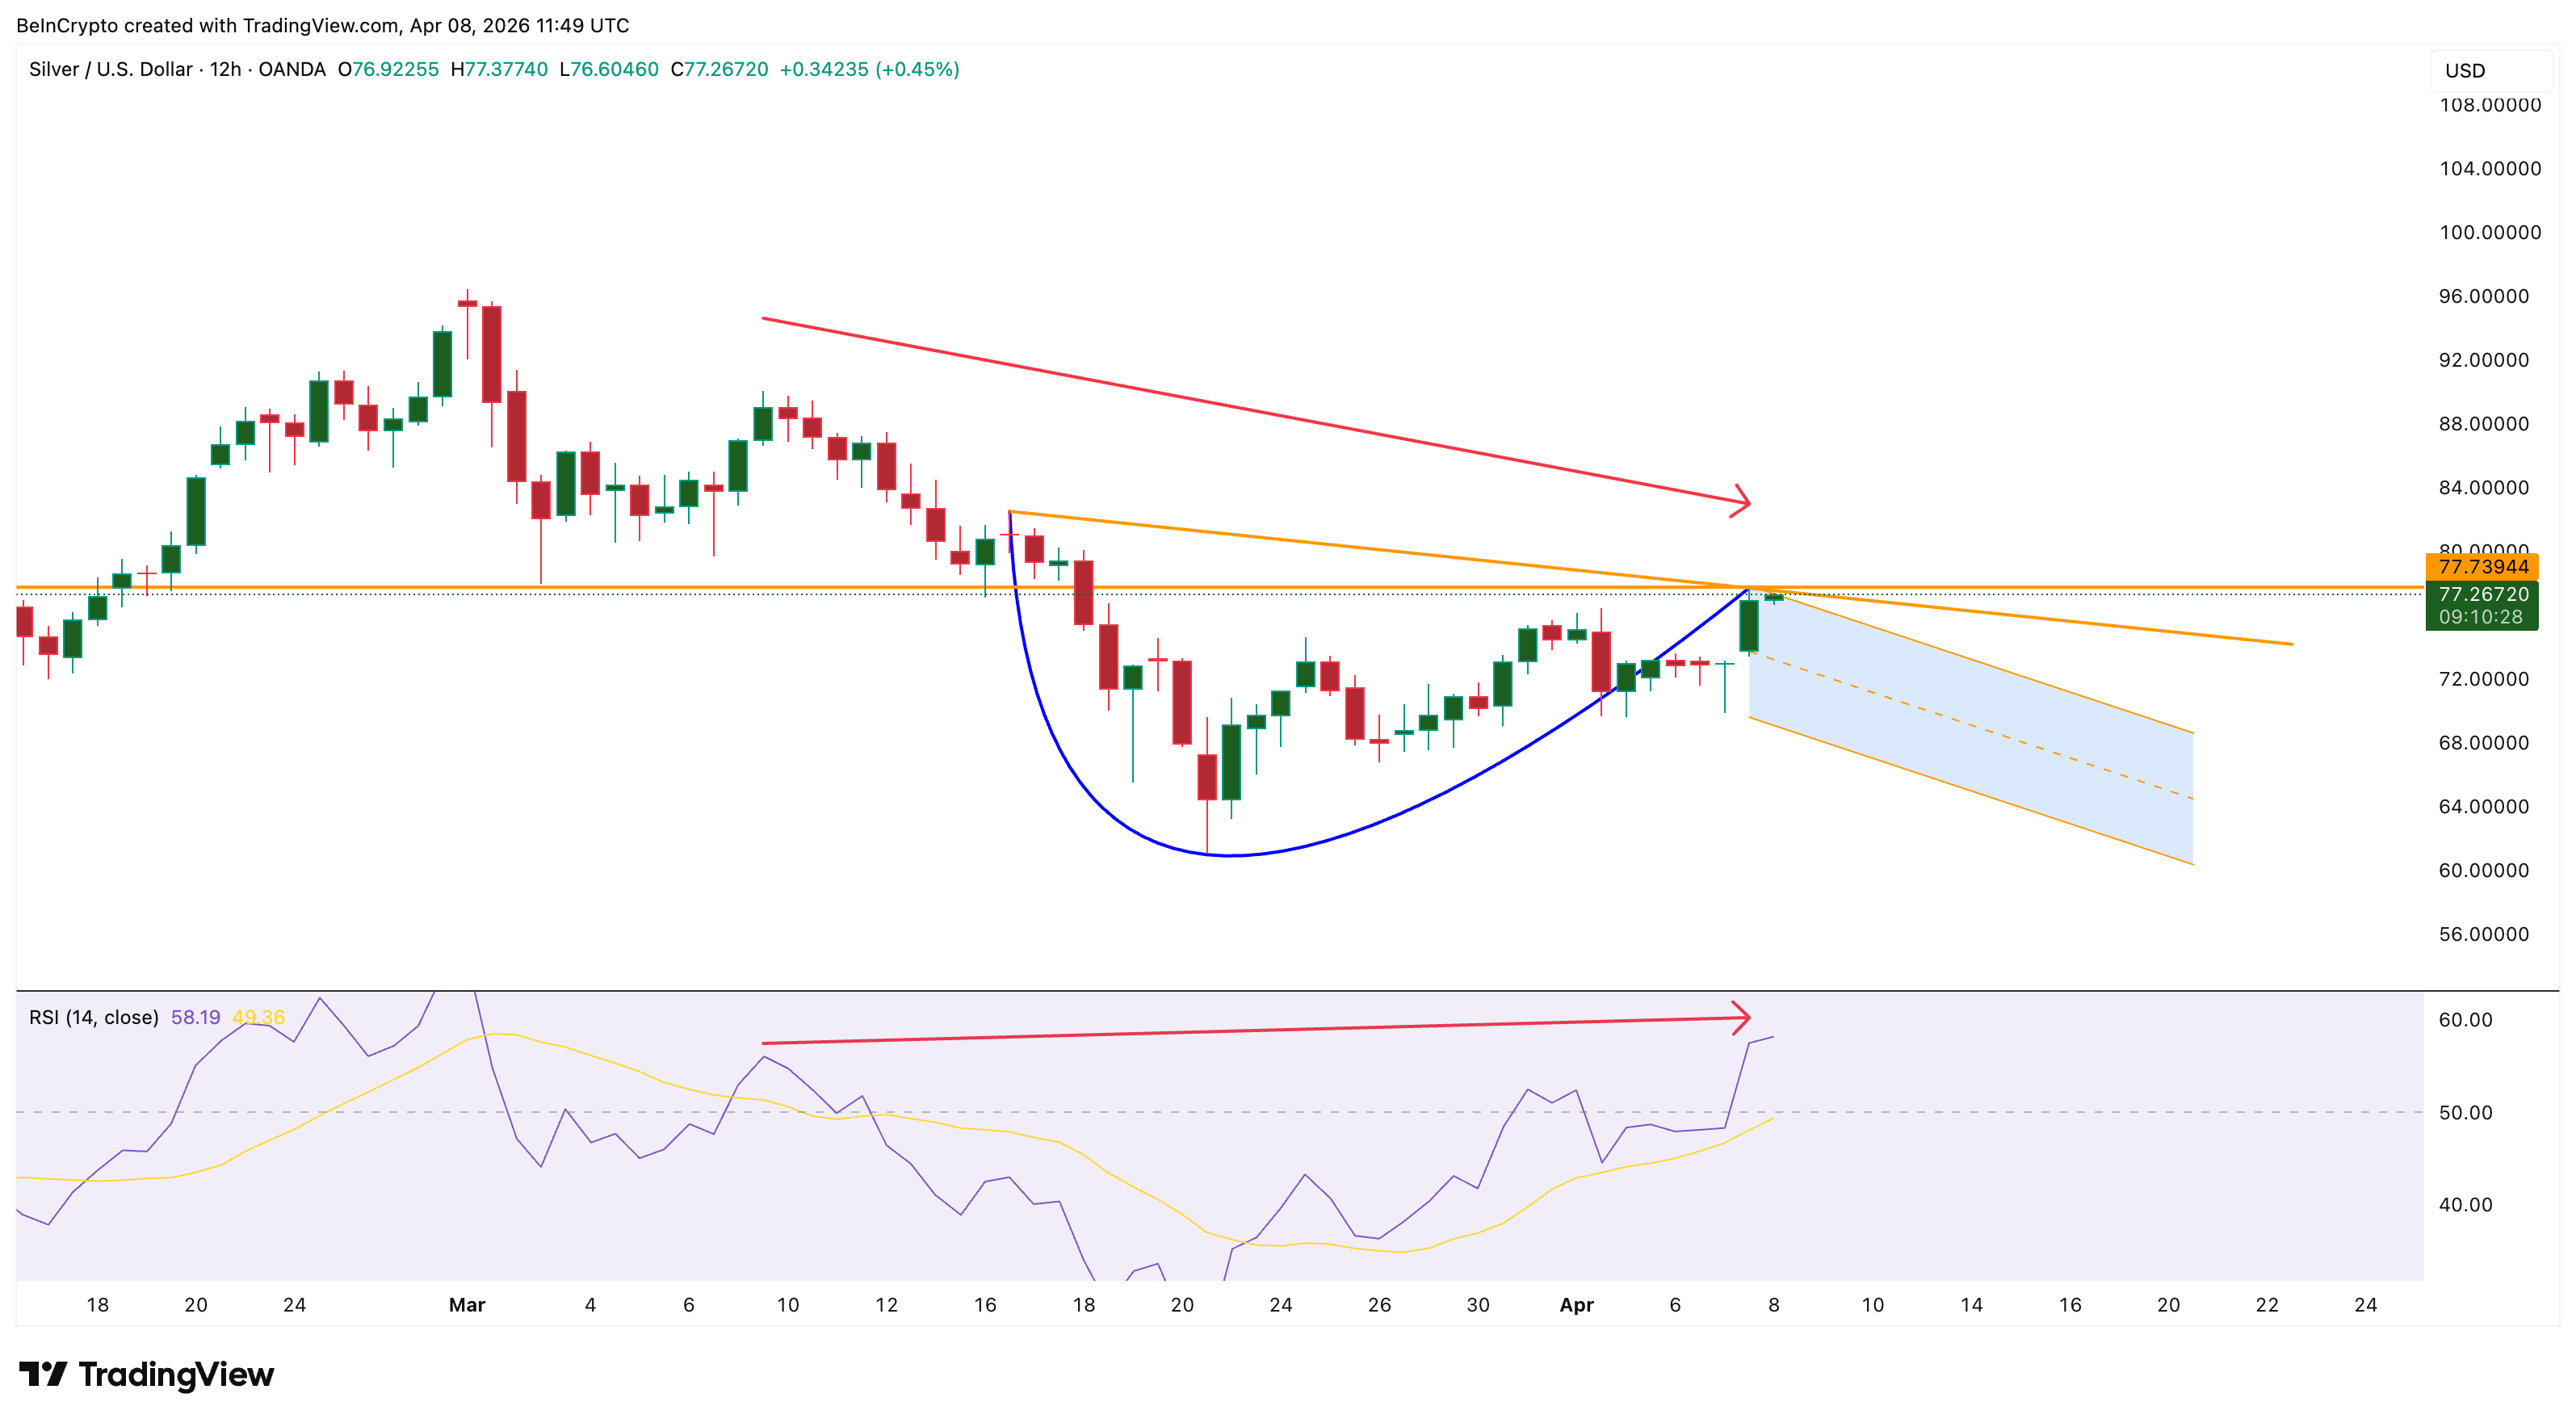
The deeper handle will not void the cup. Handles are expected to decline before breaking higher. The question is how deep it goes and whether the broader macro backdrop gives silver enough support to keep the handle shallow.
Contango futures show no urgent need for delivery yet
The spread between the first-month and second-month silver futures contracts (SIL1! minus SIL2!) is at -0.55, a condition called contango, whereSilver futures pricesTrade higher than near-term prices. This means that buyers are not scrambling for immediate delivery.
For context, this spread peaked at 7,875 in early February and reached 6,515 in early March, both periods when silver prices were rising and physical demand was tight. A collapse from those highs into negative territory shows that the urgency has evaporated.
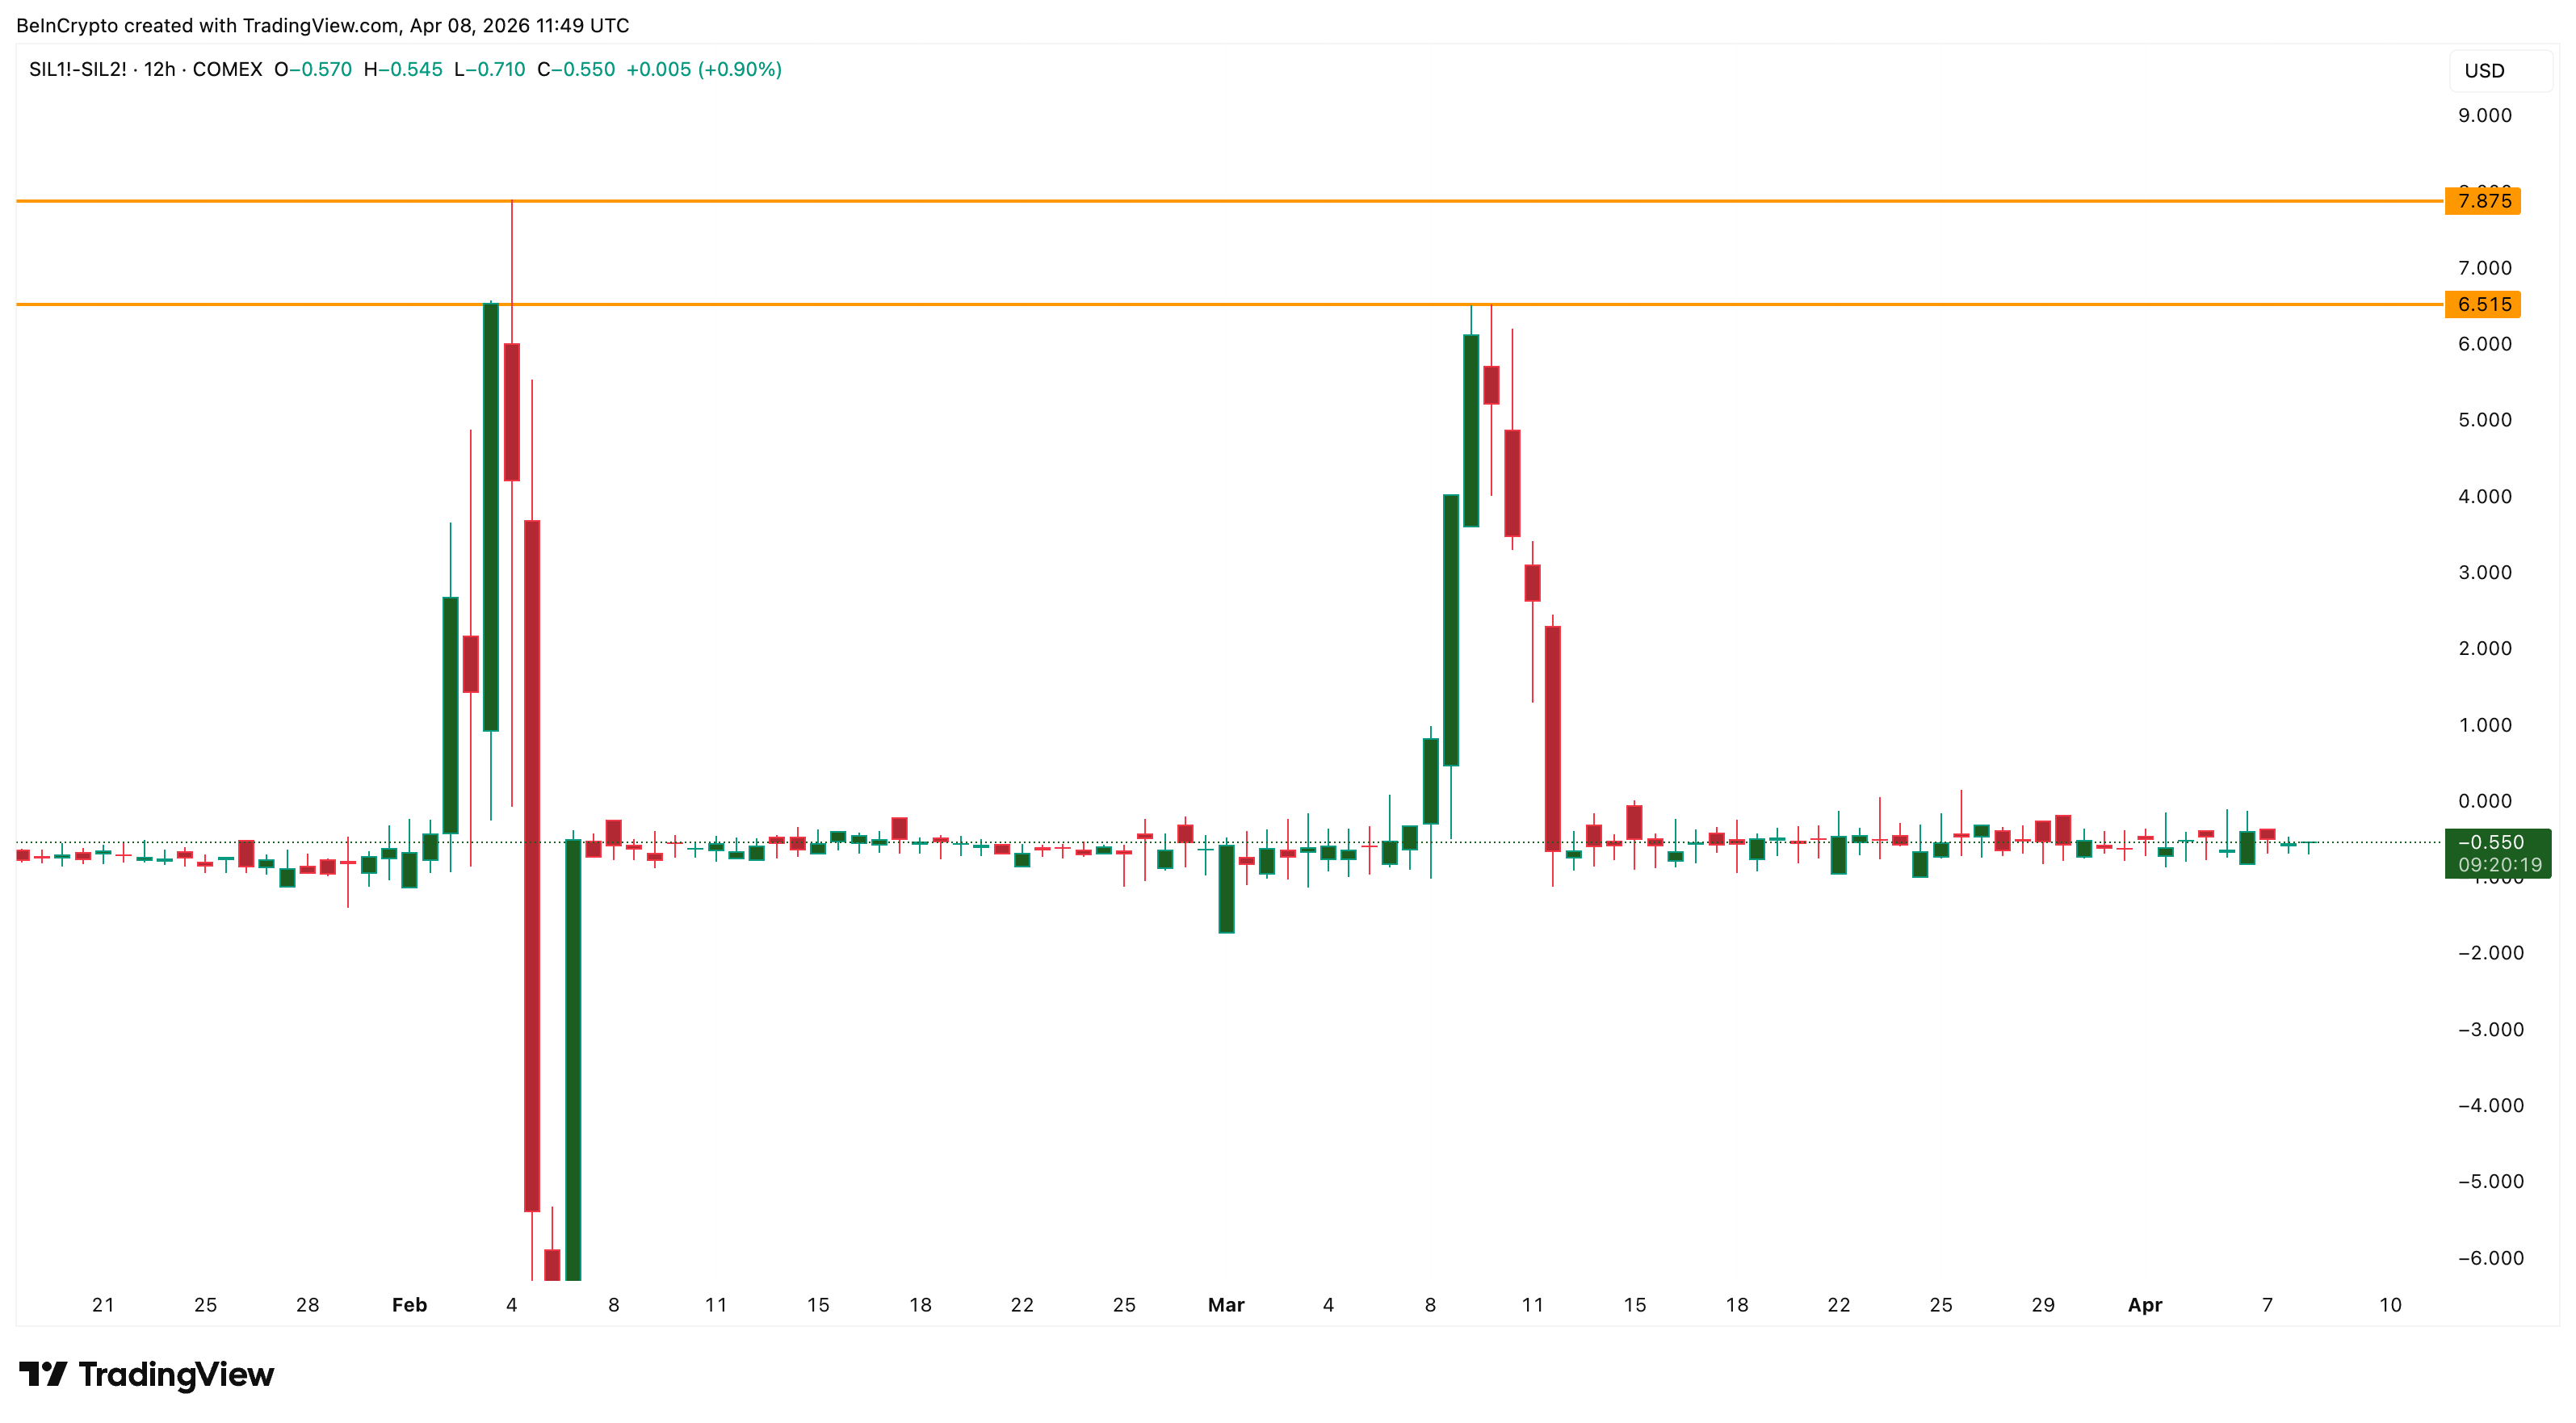
Contango doesn’t kill the rally, but it does indicate that the current movement is driven by macro positioning rather than physical supply pressure. For the cup pattern to produce a sustained breakout, the spread must shrink back toward zero or fluctuate positively, indicating that real demand is catching up with price.
However, the overall situation is changing rapidly. The reason lies in the dollar and in the options markets.
The decline of the dollar and the decrease in the proportion of buying and selling fuels the bullish situation
The ceasefire led to an immediate repricing of basic commodities. Brent crude falls 15% The de-escalation between the United States and Iran removed the war premium from oil. When the price of oil falls, it reduces the effect of the petrodollar, as oil-importing countries need to buy dollars to pay for crude oil. Lower demand for the dollar means a weaker dollar in the short term.
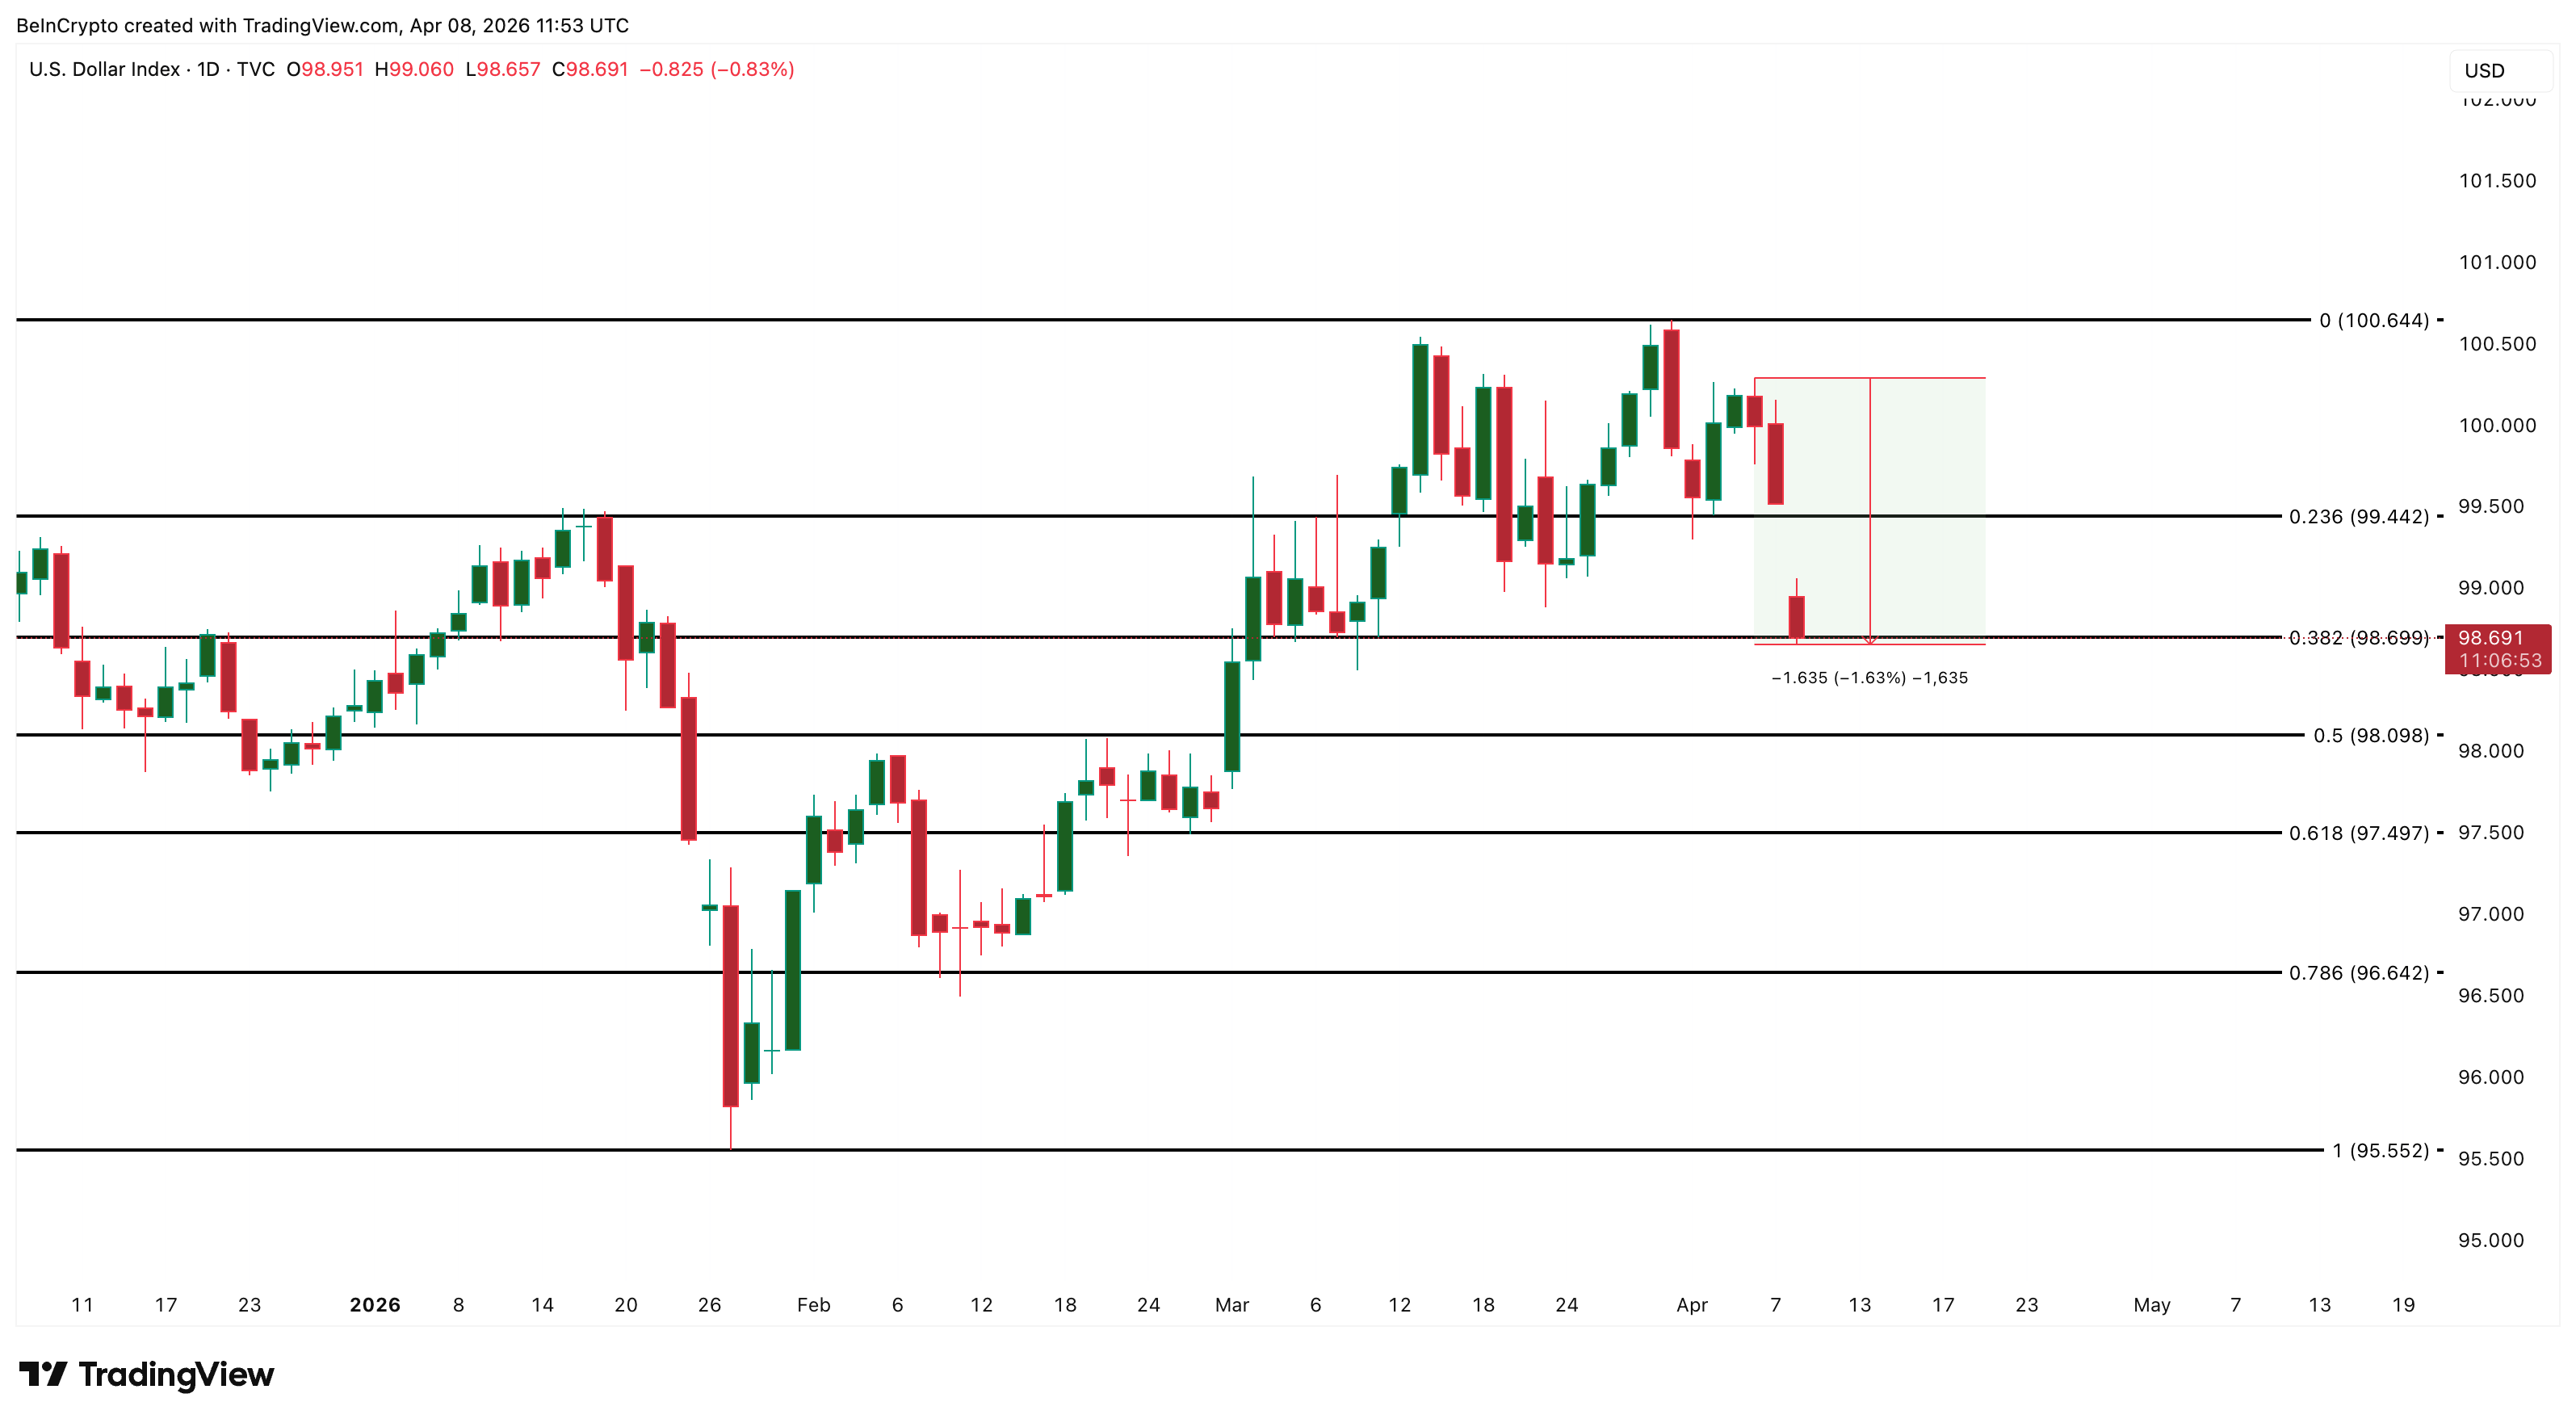
The DXY has fallen 1.63% from its high on April 6 and now stands at 98.69, right at the 0.382 technical support level. If this level is broken, the next stops will be 98.09 and 97.50. Historically, every decline in the dollar provides a tailwind to the price of silver because the metal becomes relatively cheaper for buyers holding other currencies.
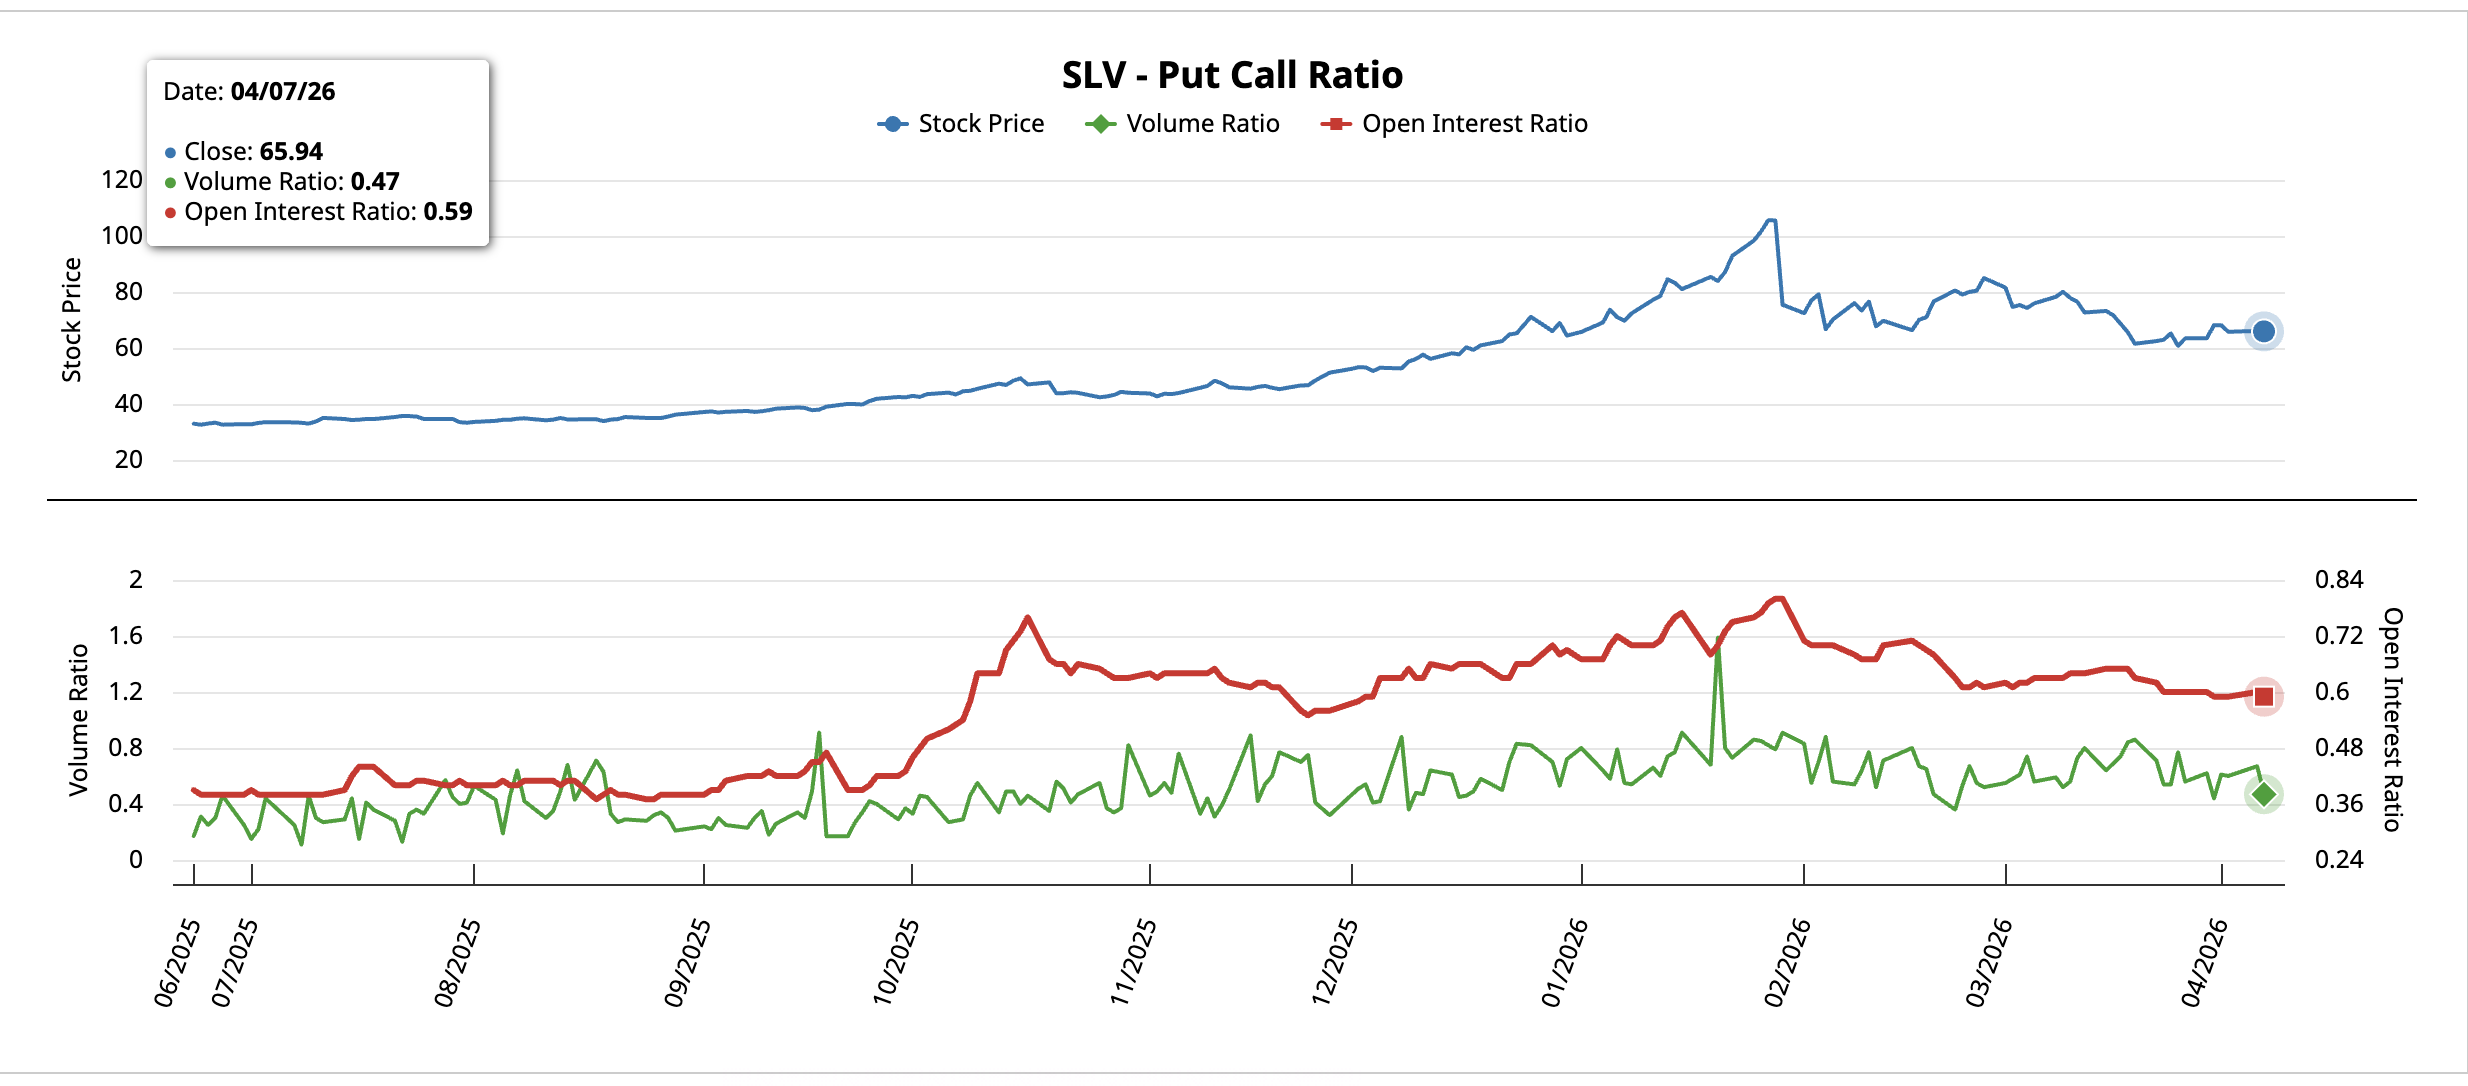
The options market confirms this shift. The iShares Silver Trust (SLV) call put ratio, which compares bearish put options with bullish call options, fell from 0.67 on April 6 to 0.47 on April 7. The open interest ratio also decreased from 0.60 to 0.59. Both readings are well below 1.0, meaning that call buyers dominate. The decline between April 6 and 7 indicates that bearish bets have eased as the ceasefire changes the overall picture.
With the dollar weaker, oil lower, and options positions turning bullish, the silver price chart becomes the final call.
Silver price levels that determine whether $100 is possible
Silver is trading at $77.31. The cup neckline is between $77.29 and $77.73. A 12-hour close above $77.73 will confirm a cup breakout.
Above the neckline, the $79.12 level at 0.618 is the first real confirmation zone. A close above $79.12 would confirm the validity of the breakout and shift the target to the upside. The $85.07 level becomes the first major target. If momentum continues, the 1,618 extension at $94.69 and the 32% fully measured move expectation at $102.29 (+$100 zone) will come into play.
For a goal of $100 In order to become realistic, two conditions must be present simultaneously. The dollar should continue to weaken below 98.69, and futures should contract as physical demand returns. Without both, the rally risks stalling at the $85 area.
The cup patterns that form during macrosystem transformations carry nuance. If the macro catalyst fades, such as a ceasefire breakdown or a dollar rebound, the cup could turn into a failure pattern rather than a confirmed breakout. The RSI divergence already indicates this risk.
On the downside, $75.45 at 0.382 is the first support level. A deeper handle could test the $73.18 level. The $69.51 level represents a critical lower bound and a break below would weaken the pattern significantly. A drop below $60.88 completely invalidates it.
Right now, the $77.73 level separates a confirmed cup breakout from a path toward $85.07 and eventually $100 from the handle that deepens toward $73.18 and the $69.51 floor.
this post Can silver price ride the ceasefire wave to exceed $100? The dollar’s decline opens the door appeared first on BeInCrypto.


