

Ethereum has been quietly building pressure beneath the surface, trapped within a tight wedge structure that has been pressuring price action for months. With volatility reaching historically low levels according to the BBWP indicator, the market is signaling that a big move is imminent – one that could confirm a strong recovery or accelerate a deeper decline.
In this analysis, we break down the daily and 4-hour charts to plot the key levels, patterns, and scenarios that every ETH trader needs to monitor right now.
The Bigger Picture: Falling Wedge and Overall Fibonacci Levels
Ethereum has traded within a well-defined falling wedge since its October 2025 highs, resulting in a series of lower highs and lower lows as the structure tightens towards its peak. The wedge converges in late April/early May 2026, meaning a decisive directional move is quickly approaching.
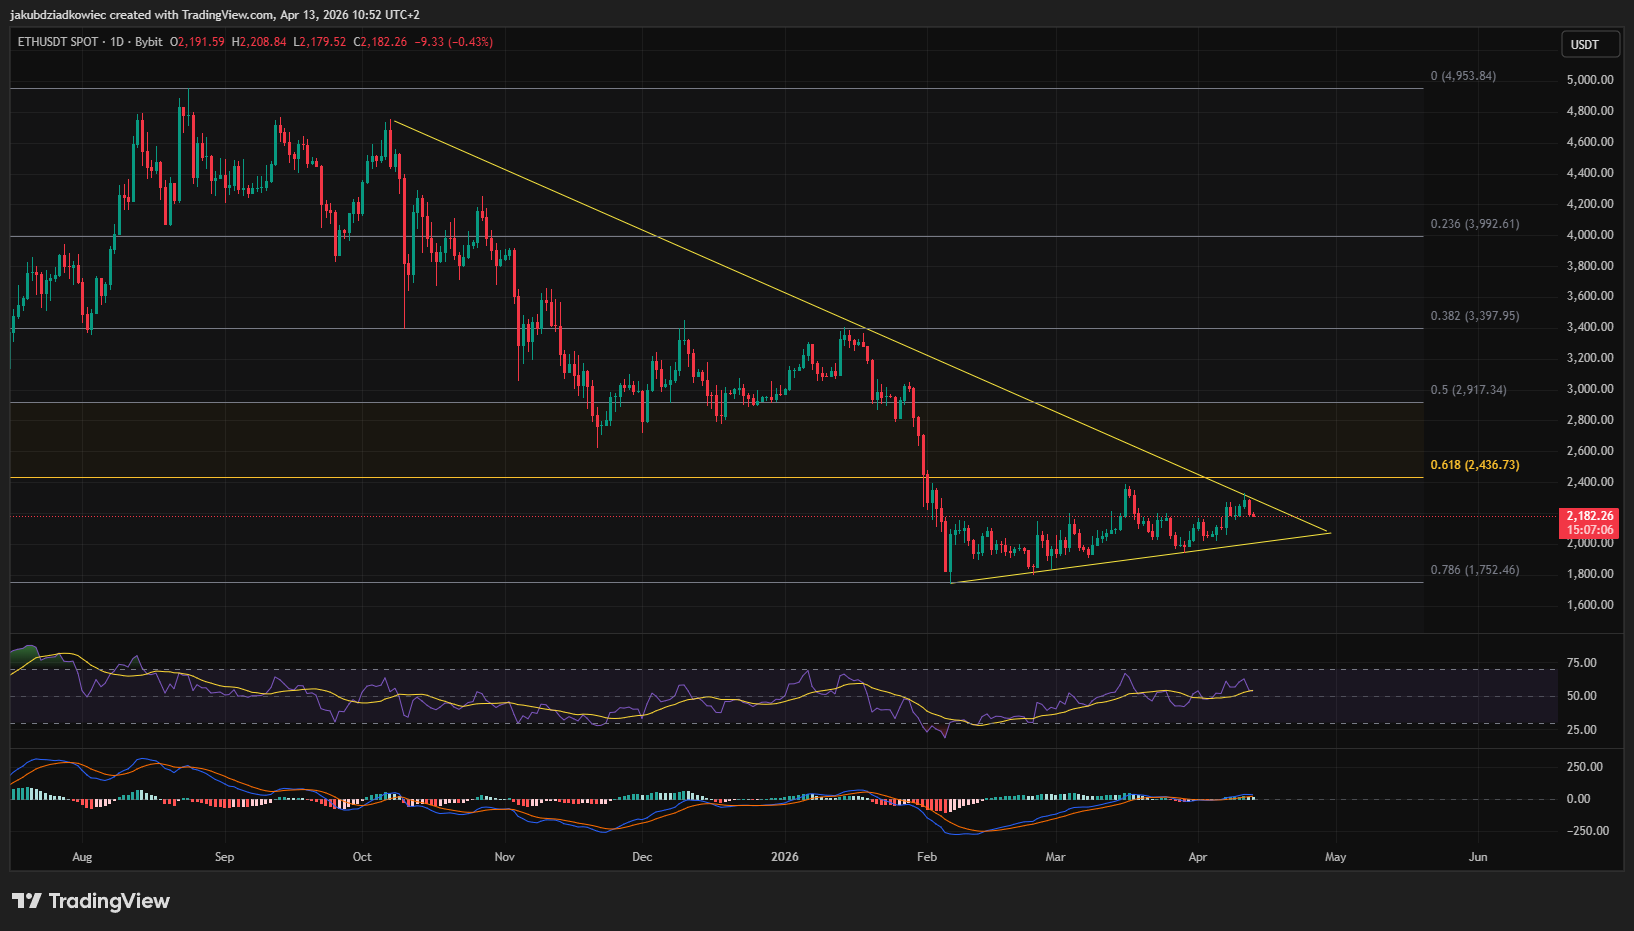
The Fibonacci retracement levels on this chart are not short-term instruments – they are taken from the macro cycle low at around $880 in June 2022 to the macro cycle high at $4956 reached in August 2025. This gives exceptional weight to key levels: the 0.618 retracement at $2436 acts as a major resistance ceiling, while the 0.786 retracement at $1752 represents a macro. Decisive. Support below.
At the current price of $2,182, Ethereum is in a pivot zone – below the 0.618 Fibonacci resistance and above the 0.786 support level. The RSI is hovering around the neutral zone at 50-55, confirming that neither the bulls nor the bears have taken decisive control yet.
Calm before the storm: 4-hour chart and BBWP
Zooming in on the 4-hour chart, the falling wedge structure itself becomes clearer, revealing two well-defined areas that have repeatedly forced price action. The strong resistance block is located between $2,300 and $2,400, which corresponds precisely to the overall 0.618 Fibonacci level – the price was rejected from this area twice, in mid-March and again in early April 2026.
Below, the strong demand zone between $1,900 and $2,000 has served as a reliable floor, absorbing selling pressure on multiple occasions. Every dip in this green zone attracts buyers, making it the key level to watch if the price continues to decline.
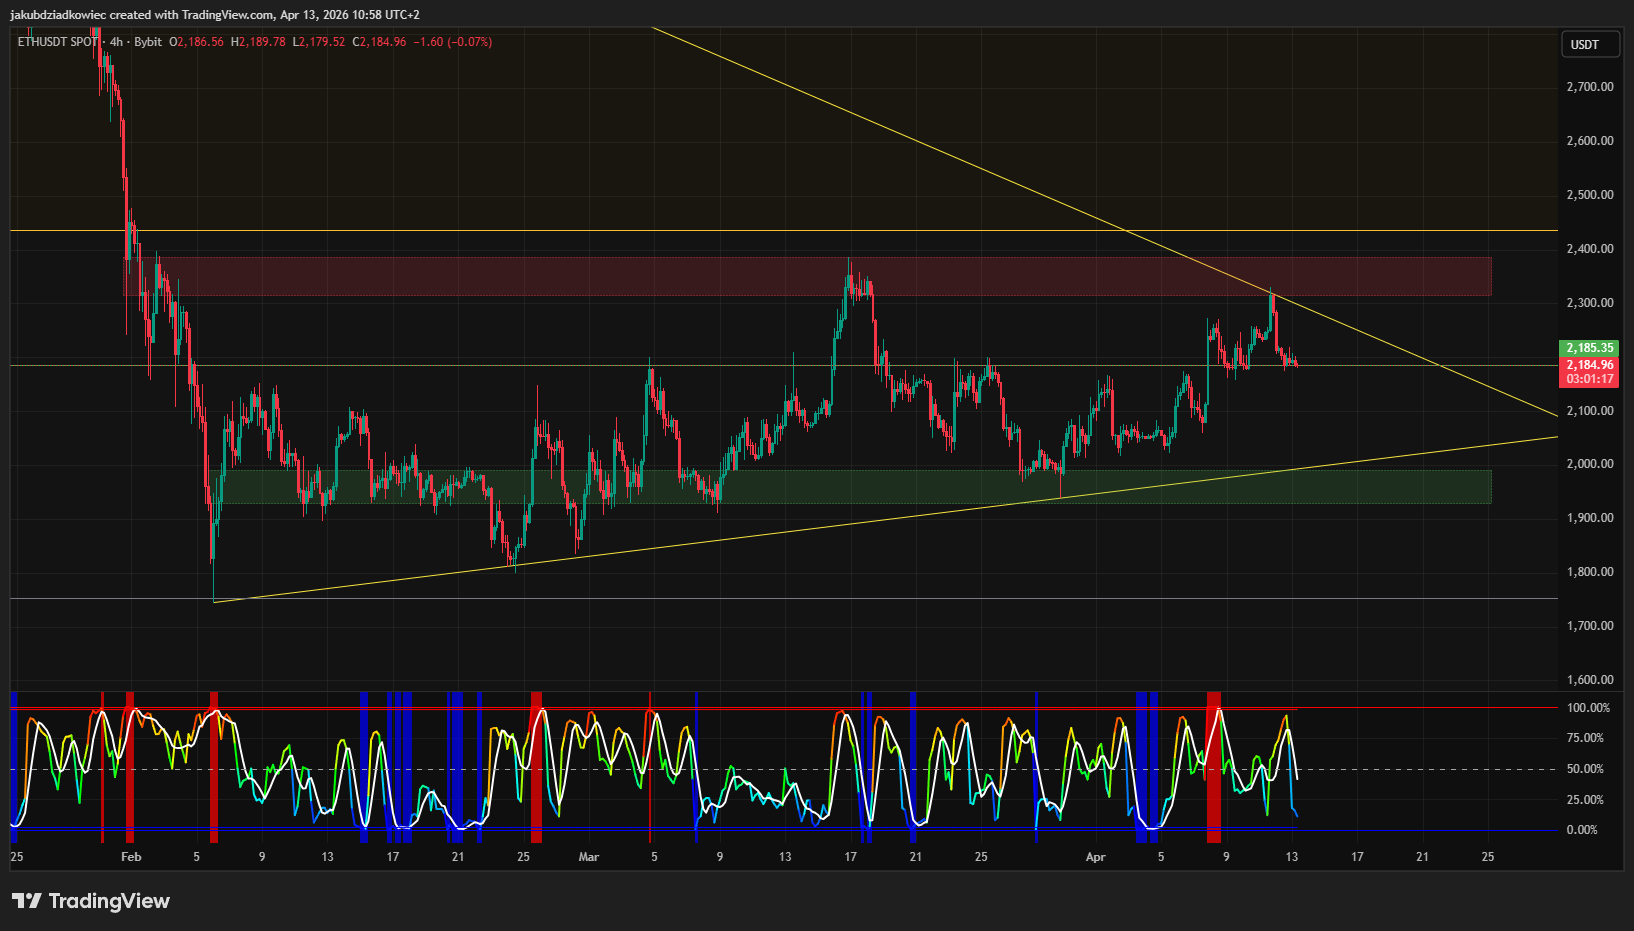
The BBWP (Bollinger Band Width Percentile) indicator on the 4-hour chart tells a compelling story about volatility. Each major price rally — February’s collapse to $1,750, March’s surge to $2,380, and April’s rejection — was accompanied by a BBWP reading near 100%, signaling peak volatility and exhaustion of those moves.
Crucially, BBWP is now pressing sharply after rising in April, reflecting a significant contraction in volatility. This is the market’s historical way of turning around before the next explosive release – and with the top of the wedge just weeks away, the timing couldn’t be more crucial.
ETH Price Forecast: Bullish and Bearish Scenarios
Bullish scenario
Confirmed breakthrough above The upper wedge trend line and resistance area at $2,300 to $2,436 indicate that the bulls have taken control. The first major target would be the 0.5 Fib level at $2,917, followed by the 0.382 level at $3,397 if the momentum continues to build.
A sudden spike in BBWP accompanying a breakout would confirm that the move is real and explosive, and not a false breakout. This scenario supports the falling wedge formation, which is a classic bullish reversal pattern.
Bearish scenario
A breakout below the lower wedge trend line and the key demand area at $1,900-$2,000 would indicate that the bears have won this battle. The immediate target in this scenario would be the overall 0.786 Fibonacci support at $1,752 – a level that must remain held to prevent a deeper breakdown.
A rise in BBWP accompanying a breakdown would confirm that a highly volatile downward move is underway, which could accelerate the sell-off. In this scenario, a loss of $1,752 would open the door to significantly lower prices and invalidate the bullish structure completely.
this post Ethereum Volatility Stress Signals Calm Before the Storm – Key Levels to Watch appeared first on BeInCrypto.


