

Bitcoin is showing signs of tentative recovery after gaining $60,000 support. The price is now around the low $70,000 area again. The overall situation changed slightly with news of a temporary ceasefire in the Iranian conflict, which had previously weighed on risk sentiment and commodity markets.
This geopolitical development could lead to a dilution of direct aggregate risk premia. However, the ceasefire is widely described as fragile and conditional, with major conflicts unresolved.
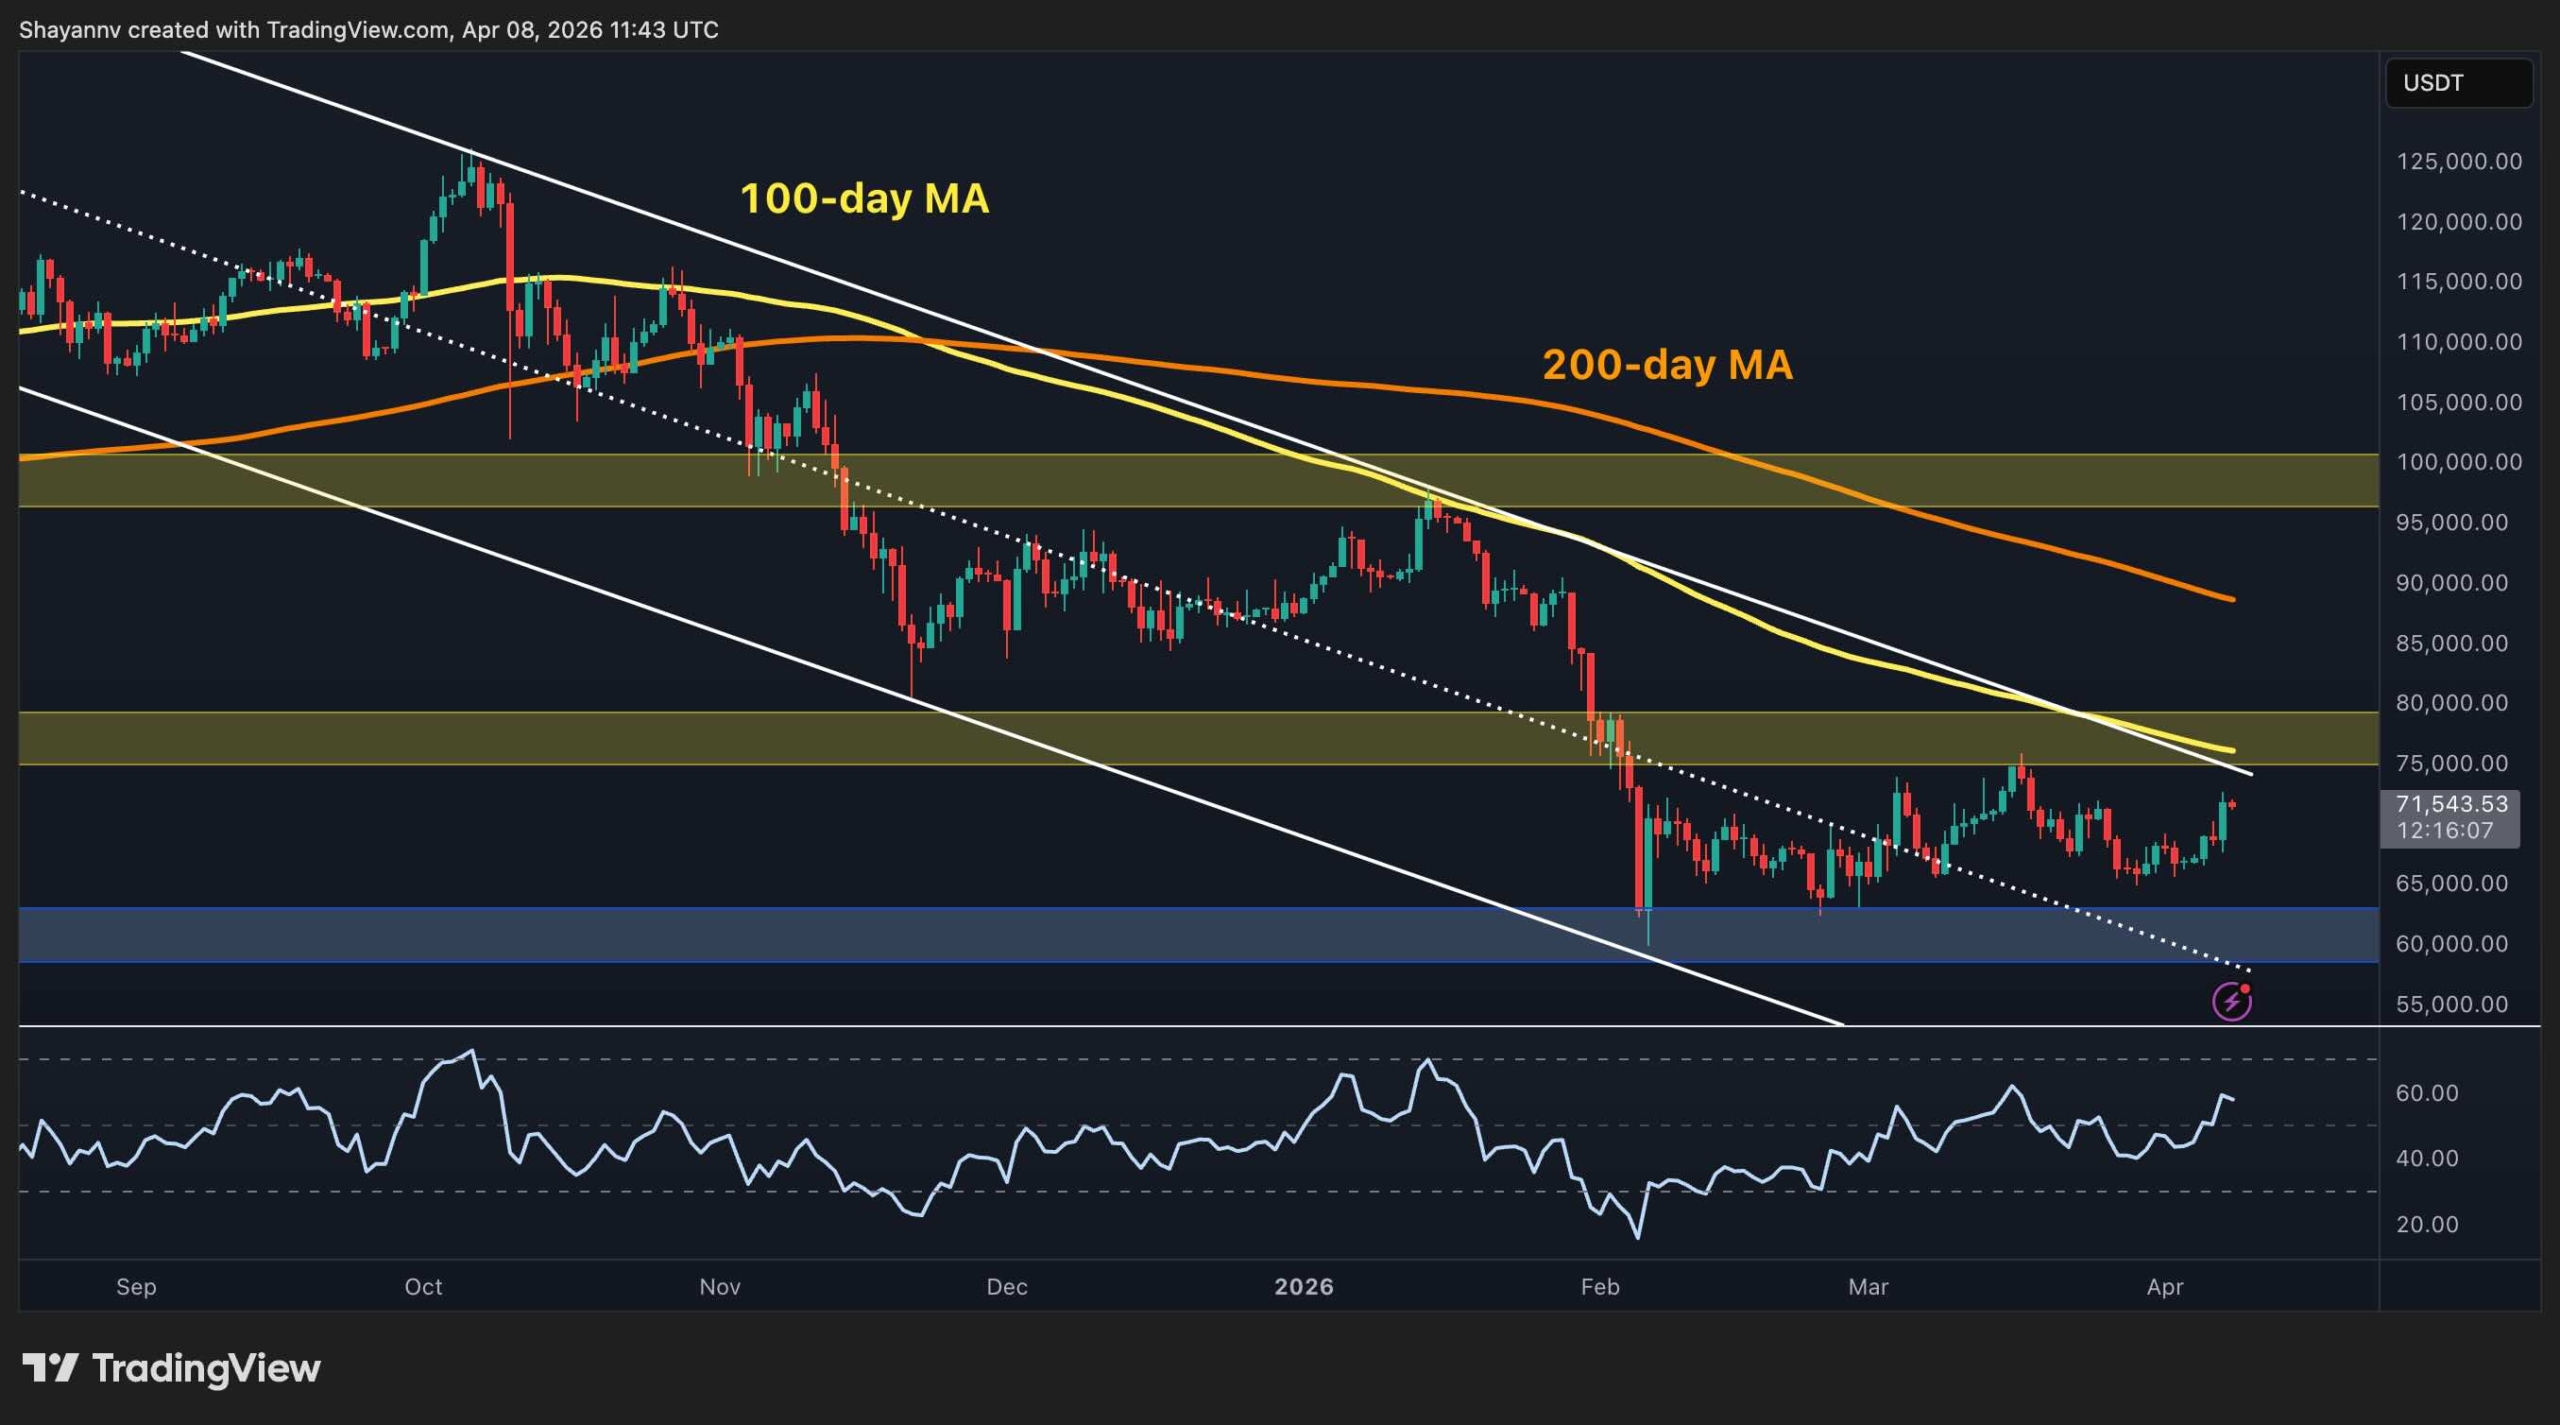
Bitcoin price analysis: daily chart
On the daily time frame, BTC price remains in a long-term downtrend. The trend is determined by the 100-day (~$75K) and 200-day (~$90K) moving averages, which continue to slope down.
With the RSI also showing upward momentum, the price is now on track to retest the $75,000-$80,000 supply zone. This area is accompanied by the upper limit of the long-term descending channel and the 100-day moving average. This confluence makes the $75,000 level a key area to watch.
A break above the above area could pave the way for a rally towards the 200-day EMA, possibly a retest of the $100,000 level. On the other hand, if the price is rejected from the $75,000 area, another decline towards the $60,000 support level can be expected in the coming weeks.
BTC/USDT 4-hour chart
On the 4-hour chart, Bitcoin remains range bound within an ascending channel, with a lower limit near $66,000 and an upper limit near $78,000. The price recently tested the lower limit and rebounded. The inside trend is showing short-term highs over recent sessions, indicating a move towards the $75,000 horizontal resistance level.
Momentum also shows the dominance of buyers, but with the RSI moving around the overbought zone, the market may take longer than expected to clear the mentioned resistance. On the contrary, a rejection from this level without the price even reaching the upper limit of the channel could be a warning signal pulling the price back to the $60,000 area and possibly lower.

On-chain analysis
From a chain perspective, the Net Unrealized Profit/Loss (NUPL) metric is in low profit share territory similar to levels seen during previous major accumulation phases, suggesting that many token holders are not realizing significant gains. This often indicates a cautious market that has absorbed more of the previous downturn without renewed speculative excess.
This backdrop could provide a basis for a more volatile consolidation rather than a sustained sell-off. However, if the price starts recording higher highs and lows soon, this could indicate that the current phase is a heavy accumulation, and could set the market up for a sustained recovery in the coming months.

Free Binance $600 (CryptoPotato Exclusive): Use this link To register a new account and get an exclusive welcome offer of $600 on Binance (Full details).
Limited offer for Bybit’s CryptoPotato readers: Use this link To register and open a free position worth $500 on any currency!
Disclaimer: The information contained in CryptoPotato is that of the cited authors. They do not represent CryptoPotato’s opinions on buying, selling or holding any investments. We advise you to conduct your own research before making any investment decisions. Use of the information provided is at your own risk. See our disclaimer for more information.


