

XRP is pressing the top of the falling wedge at $1.3157 after months of lower highs and lower lows, with the 4-hour MACD signal line crossing into positive territory for the first time since February – a sign that bearish momentum may be close to exhaustion before what could be the pattern’s most important candle close.
summary
- XRP is trading at $1.3157, pressing against the top of a falling wedge pattern visible on the daily and 4-hour charts, with the daily Supertrend trending bearish at $1.4894.
- The daily MACD chart is at -0.0222, while the signal line on the 4-hour chart has crossed marginally into positive territory, indicating that the downward momentum is approaching exhaustion before the wedge resolves.
- A confirmed daily close above $1.47 targets $1.50 and a potential challenge at $1.60, while a break below $1.27 risks an acceleration towards $1.14.
ripple (XRP) is trading at $1.3157 on April 3, 2026, down 0.33% on the day and pressing near the top of the falling wedge pattern formed across the daily and four-hour time frame since February. The Supertrend indicator on the daily chart is located at $1.4894, red above the price, confirming the prevailing bearish system. However, the formation itself is a structure that technical analysts typically associate with the possibility of a bullish reversal when it appears at the end of a long downtrend, provided the lower trend line holds.
On the daily chart, two converging trend lines are clearly visible: a falling upper resistance line and a slightly higher lower support line. The price at $1.3157 is approaching the high, and recently hit a daily low of $1.3033. The daily MACD shows a histogram of -0.0222, with the MACD line at -0.0287 below the signal at -0.0065. The reading is still bearish, but the chart is contracting, indicating that the selling pressure is gradually fading.
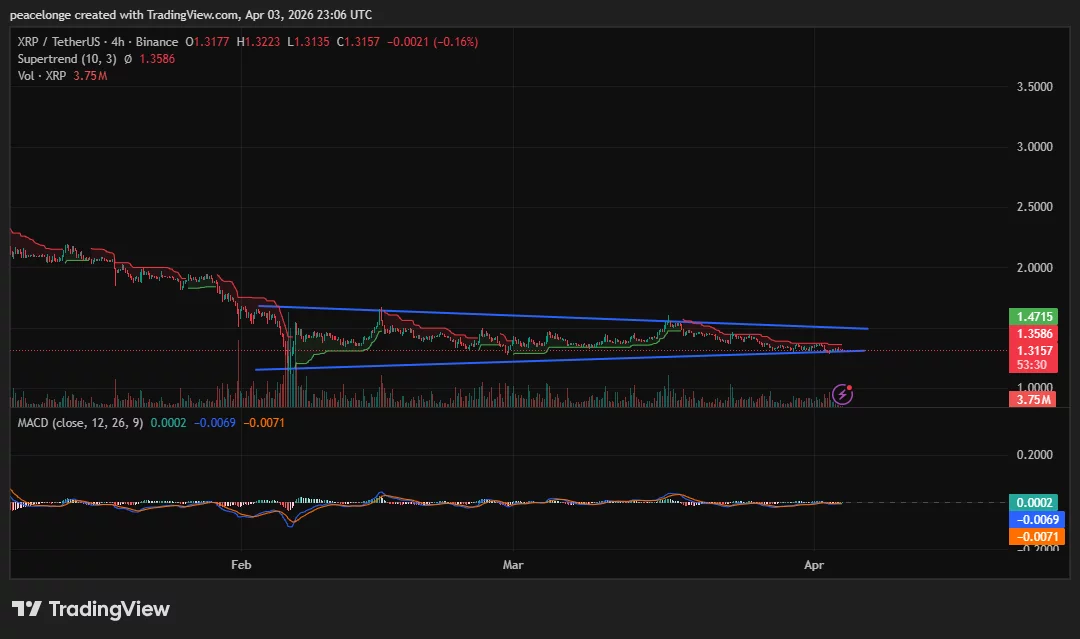
On the 4-hour chart, the same wedge structure is intact. The upper downtrend line is in line with the 4-hour supertrend at $1.3586, and the lower uptrend line has provided support on every test since early February. Crucially, the 4-hour signal line has crossed marginally into positive territory at 0.0002, while the MACD line at -0.0069 is approaching zero from below. A full MACD bullish crossover has yet to occur, but convergence at a level near zero is an early sign of bearish exhaustion.
Key levels, price targets, and invalidation
Bullish case: A daily close above the falling wedge resistance near $1.47 will confirm a breakout, initially targeting $1.4894, the supertrend level, then $1.50. Above that, the $1.60 area is the key structural area where the broader downward channel from July 2025 will be significantly challenged. Technical analyst Ali Martinez noted on
Bear Case: A daily close below $1.27 would break wedge support and expose XRP to $1.14, a conservative channel breakdown target. The dense supply pool of about 19.6 million XRP is concentrated between $1.27 and $1.28, according to Coinglass cost basis data, making it the most important demand area to defend.
Bullish case invalidated: daily close below $1.27. Invalidation of bearish condition: daily close above $1.47.
String context and derivatives
Monthly inflows of U.S. XRP’s open interest across all exchanges now stands at roughly $2.45 billion, down about 73% from its peak in September 2025, as detailed in Previous crypto.news coverage.
Funding rates turned positive at 0.008%, indicating entry into new long positions near current levels. However, the group of six- to twelve-month holders have begun trimming their positions since March 27, reducing the structural support layer precisely when the wedge reaches its apex.
like crypto.news has you coveredRecovery attempts are repeatedly stalled below downward resistance, and the pattern remains intact until buyers produce a decisive daily close above the wedge’s upper trend line. With the 4H signal line at zero and the top approaching, the next trend candle carries a lot of weight.


