Gold rebounds at the end of the week after the odds of two major interest rate hikes by the Federal Reserve this year corrected. However, the price continues to decline for the fourth week in a row. Since the second half of the week, the bears have been relentlessly trying to push the price below the psychologically important $4,000 level, but they loosened their grip on Friday afternoon. Meanwhile, longer-term moving averages are favoring sellers, as a “death cross” looms (when the 50-day moving average falls below the 200-day moving average), supported by the fact that the price is trading below this cross.
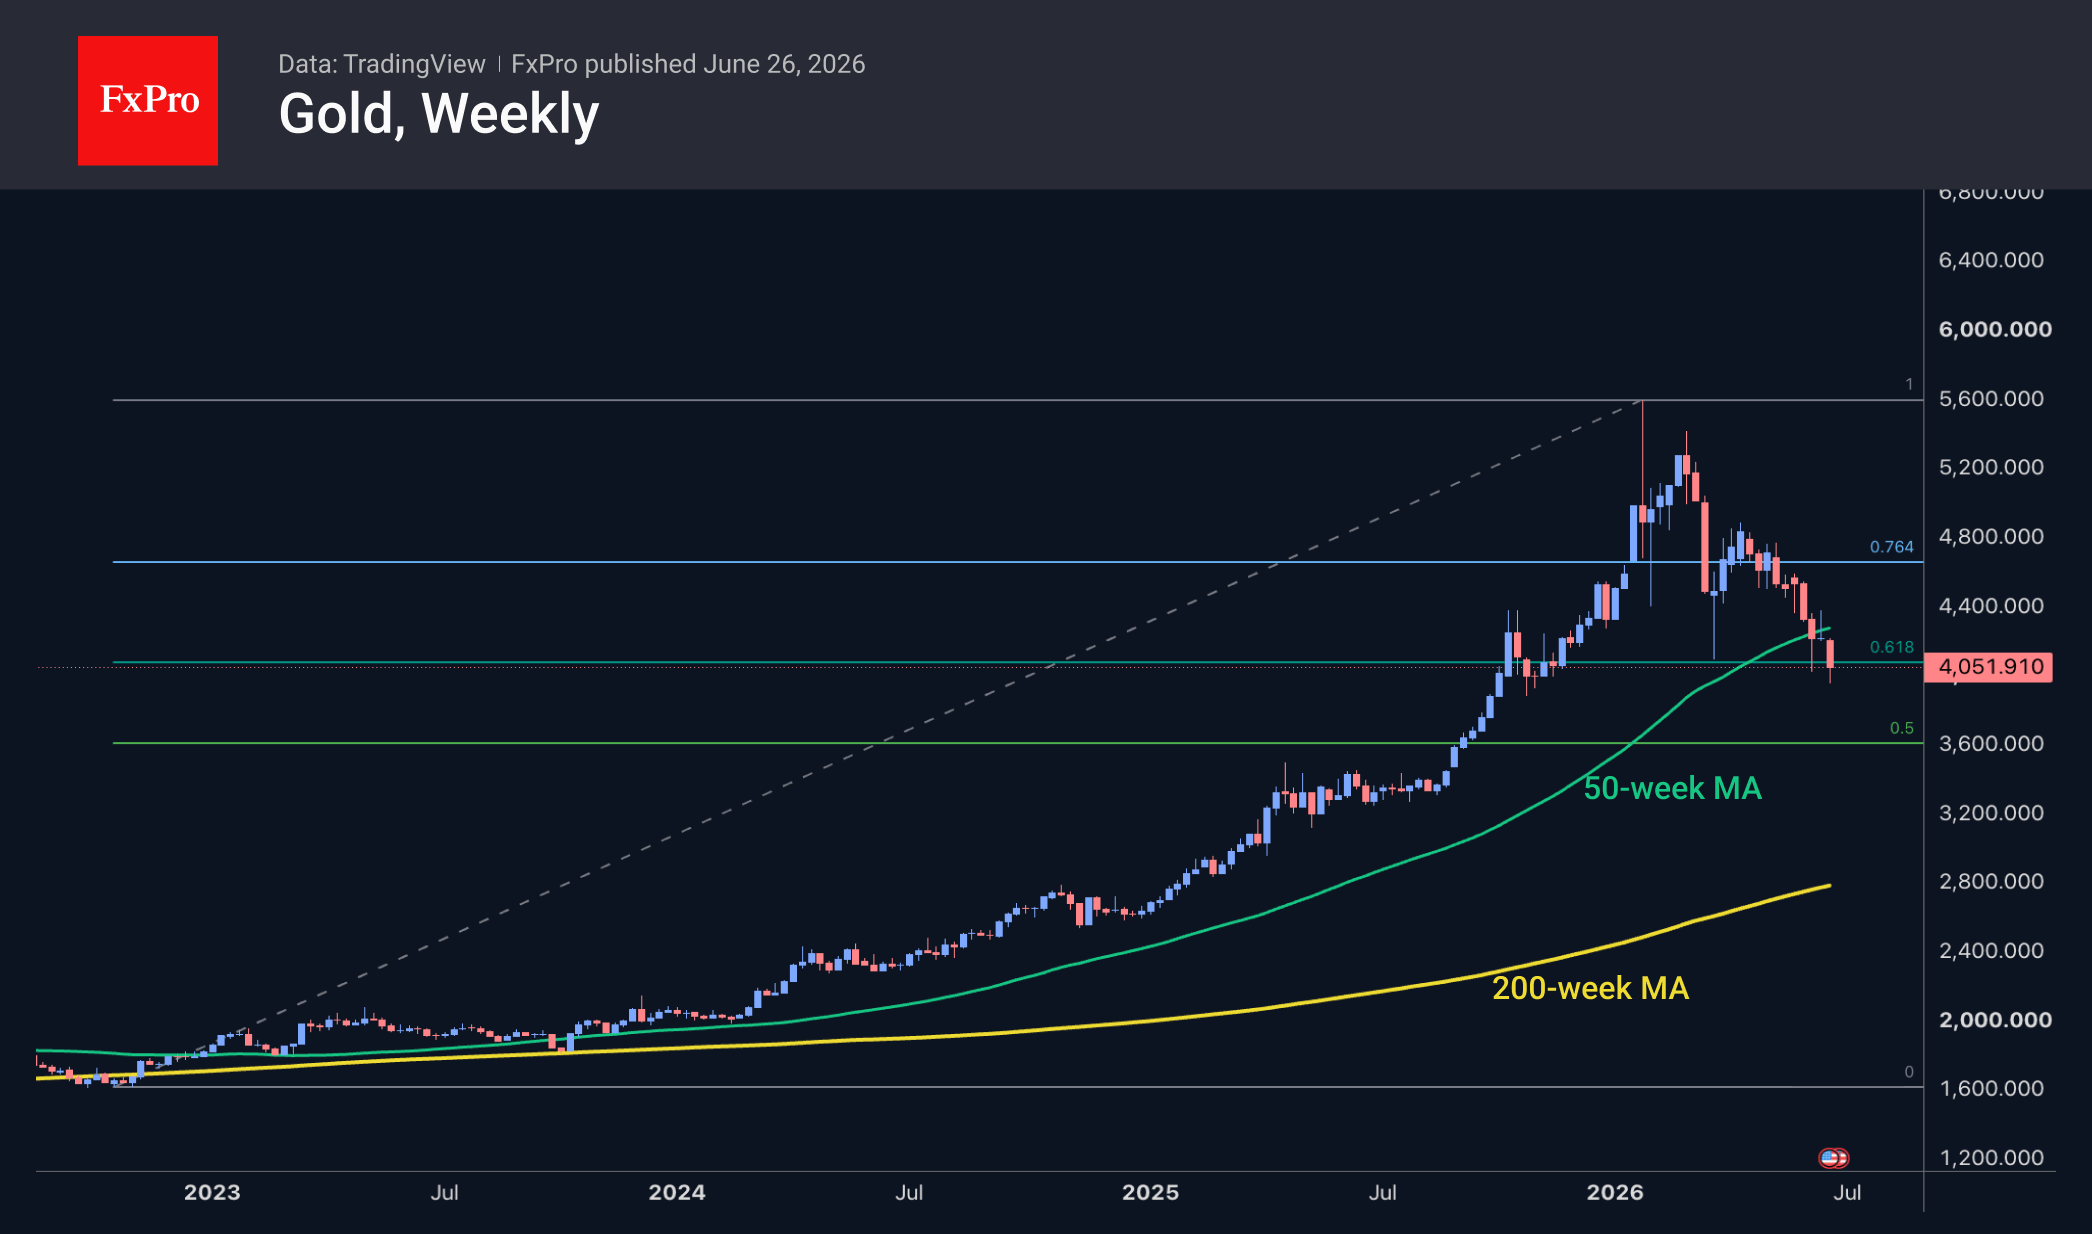
On the weekly charts, attempts to push the price back above the 50-week EMA failed. However, this is also an area of price support since the end of last year, so we can expect a fairly fierce battle around the current level.
It is also worth noting how the narrative regarding gold price movements has changed. Previously, escalation between the United States and Iran led to downward price movements, with a clear inverse relationship between oil and gold. But it is now clear that both assets can move in the same direction – down.
However, we also have to consider an alternative scenario, where the gold price corrects since the end of January after three years of growth, reaching the 61.8% level – the classic Fibonacci support level. Under this scenario, we should see a consolidation followed by a reversal to the upside, with the first stage being a recovery to peak levels around $5,600, and the second stage a rise to $8,000 as part of the expansion to the 161.8% level. However, we view this undoubtedly inspiring scenario as less likely, given the history of previous similar price booms and busts over the past half-century.
the So they broke Analyst team