
short
- Bitcoin’s price jumped 2.7%, breaching the descending resistance line that has capped every rally since October.
- Countless traders flipped to the upside, giving BTC a 69% chance of reaching $84k next.
- However, traders are giving Bitcoin a chance of reaching a new all-time high of only 6.2% before July.
Bitcoin is rising today on a geopolitical catalyst that few expected: Iran today announced the Strait of Hormuz (or. Strait of Iran(as President Donald Trump now calls it) is fully open during the ongoing ceasefire. This resulted in oil prices falling and risky assets rising in tandem.
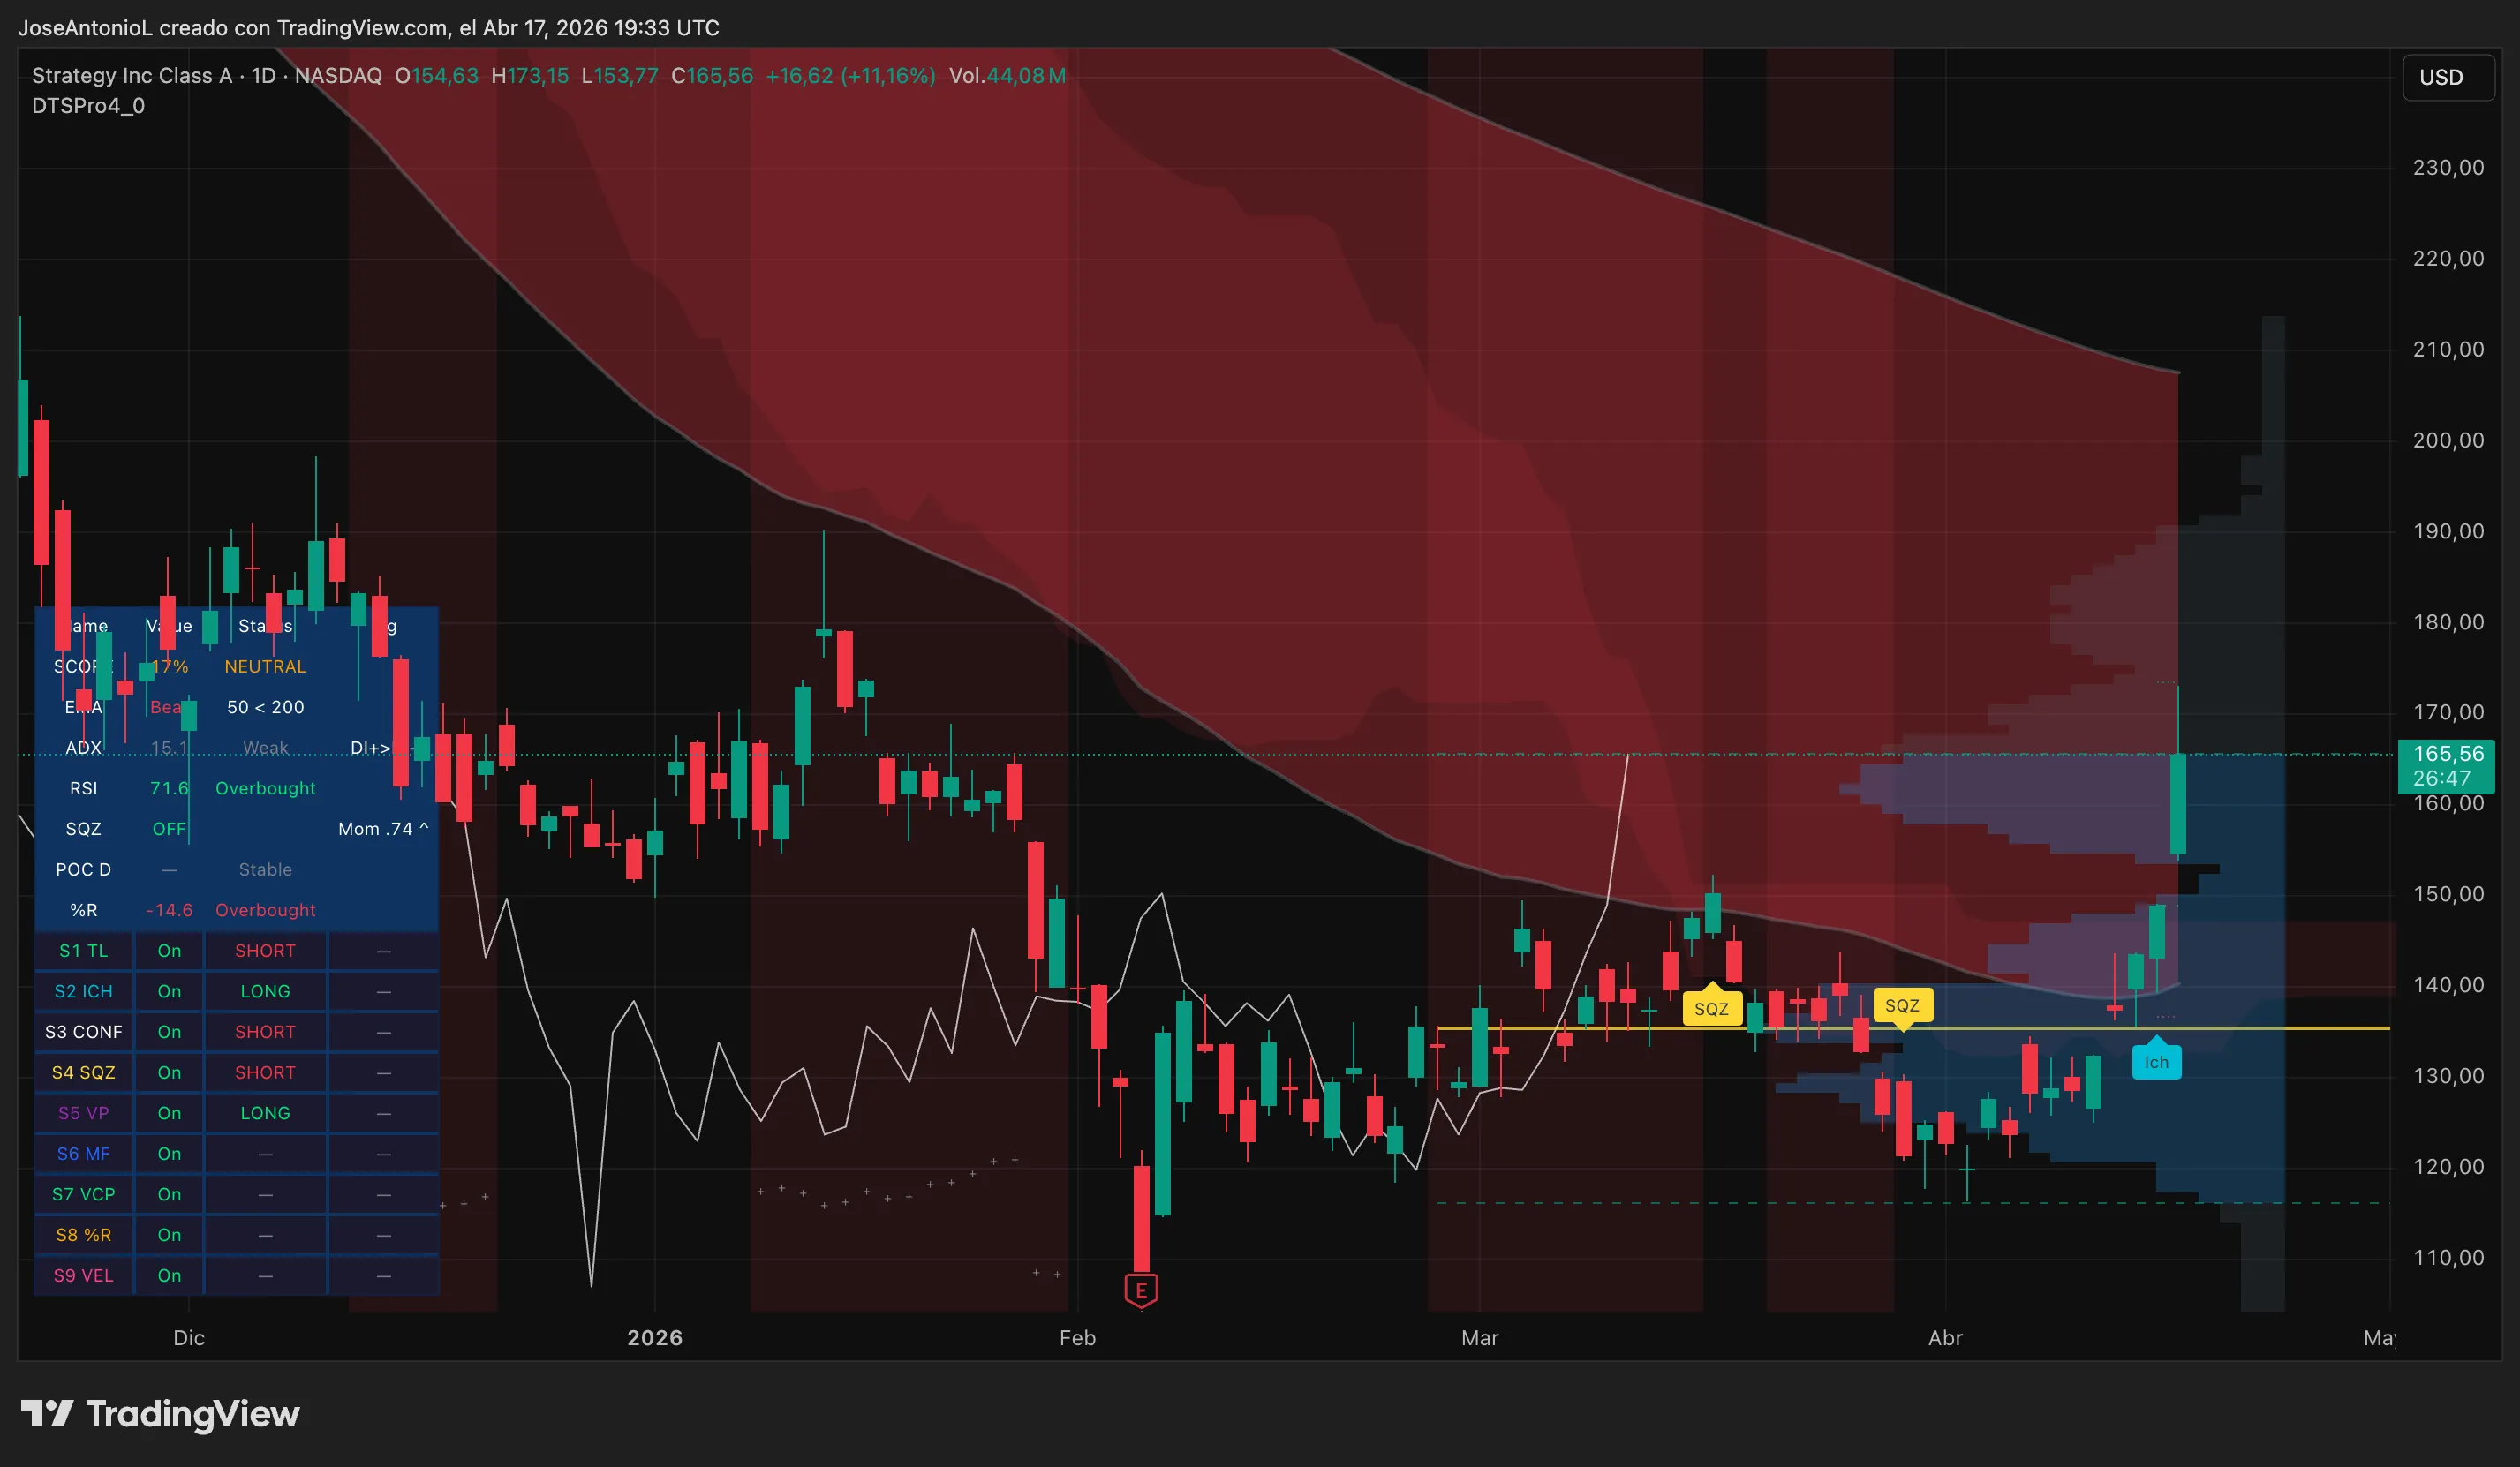
Bitcoin rose above $78,000 during the day on the news before pulling back slightly, while digital asset treasury stocks like Strategy rose more than 10% as BTC’s rise pushed its holdings out of the red.
The macro environment has been tough through most of 2026 with tensions in the Middle East, inflation fears, a strong dollar, and a lack of liquidity keeping Bitcoin in sharp decline from its October 2025 peak of $126,000.
Bulls are praying that changes this week.
Bitcoin: Breaking the pattern, but not out of danger
Today’s candle on Bitcoin charts is of great importance. Bitcoin opened at $75,172, and traders pushed the daily candle higher to $77,205 – a 2.7% gain during the session, with an intraday high of $78,384.
The move, while seemingly modest, was key to solidifying the thesis that the downward resistance trend line that has been rebuffing Bitcoin in every attempt to rally since October 2025 has finally been negated. For seven months, this line was the attraction. This was the first week that Bitcoin traded above this line since the bearish pattern began.
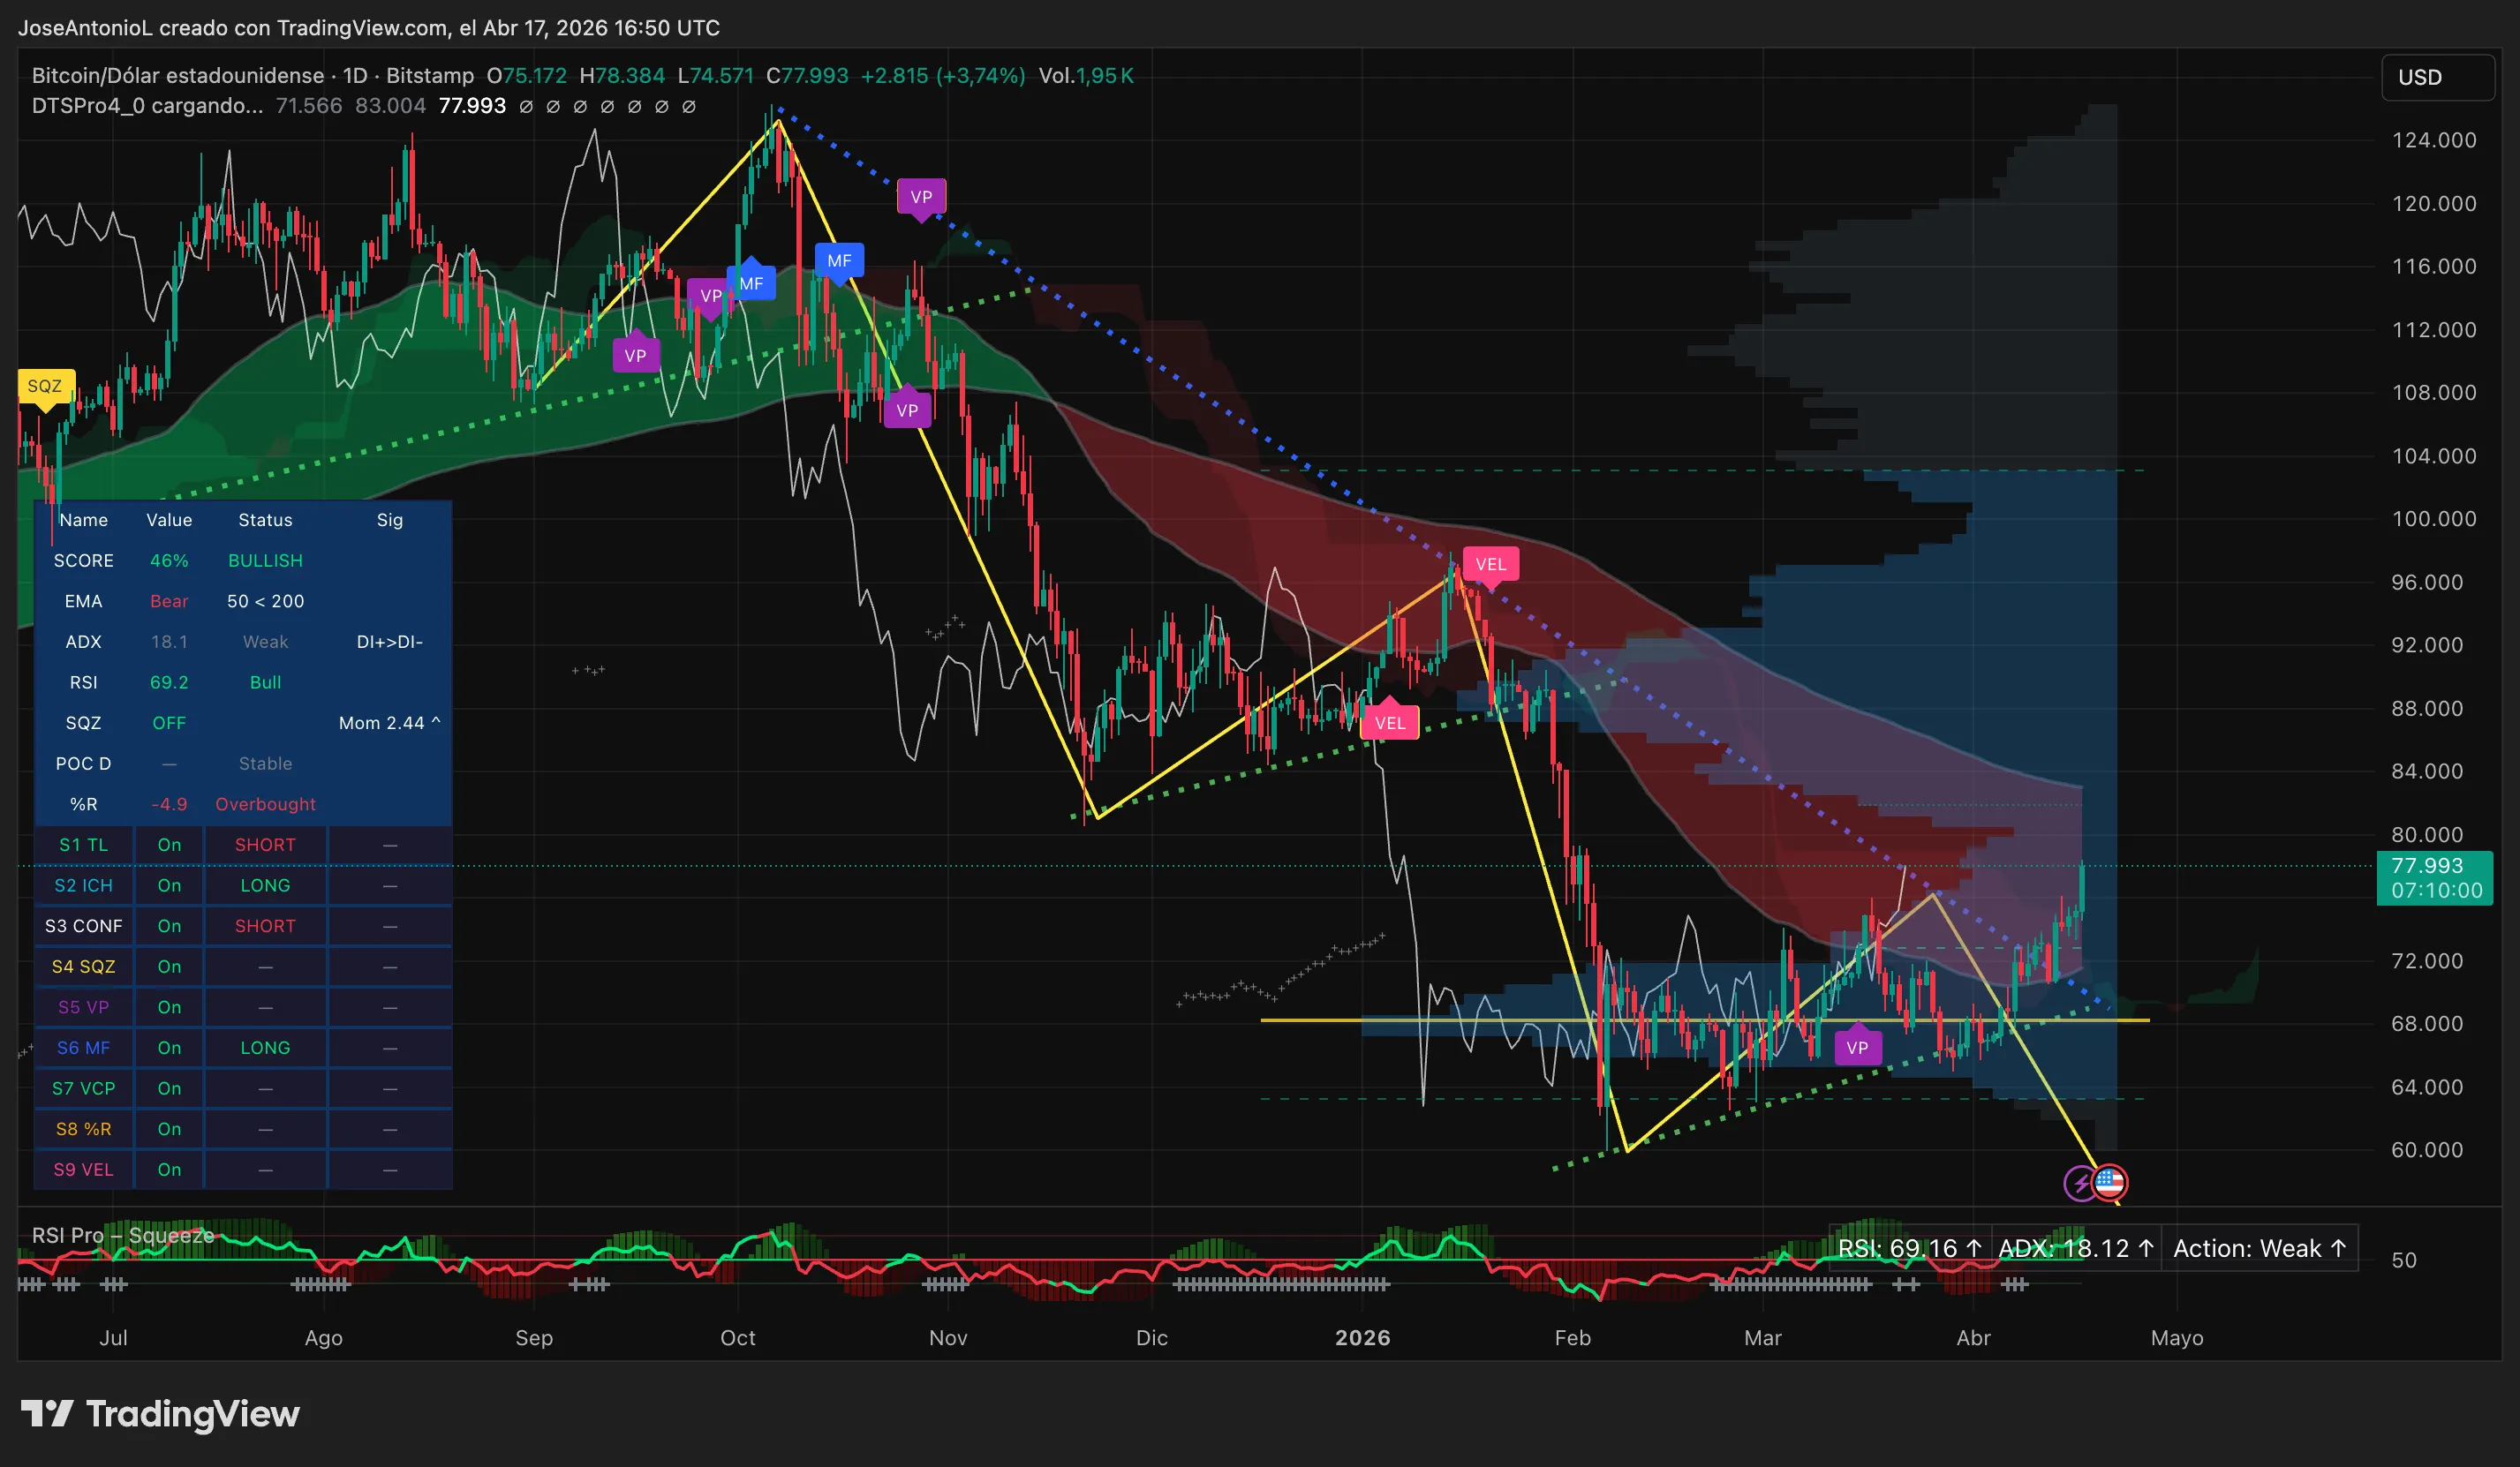
Since the all-time high of $126,000, Bitcoin has traced a descending channel — lower highs, lower lows, and a series of failed breakout attempts, each more difficult than the last. The yellow trend lines on the chart above show that over the course of months, Bitcoin registered a squeeze structure where each bounce became shallower, and each support was tested deeper.
If the trend continues uninterrupted, the math would have pointed to $50,000-$55,000 as the next logical support area. This scenario has now been delayed, if not cancelled.
The indicators also look promising for bulls. Exponential moving averages, which give traders a sense of the underlying trend based on smooth price history, remain bearish with the 50-day moving average below the 200-day moving average — a pattern that traders refer to as a death cross.
This is important because traders read a death cross as a bearish structural signal: the short-term trend is still weaker than the long-term average, meaning the recovery has not been deep or sustained enough to reverse the larger trend. The death cross does not mean Bitcoin will fall from here. This means that bulls still have a mountain to climb before this officially becomes a new uptrend.
But this is the first time since January that the gap between the averages has begun to narrow.
The Average Directional Index, or ADX, reads 18.1, which means the current downtrend is weak. ADX measures trend strength, not trend. A reading below 25 usually tells traders that the market is lacking conviction and that prices could move, but there is no real engine behind them yet. Considering that the markets have been bearish for almost half the year, a weak ADX means that this trend may be fading or that traders are accumulating as much as possible in this area.
The Relative Strength Index, or RSI, is at 67.7, which means Bitcoin is overbought but still in a manageable area. The Relative Strength Index measures the speed and magnitude of price changes on a scale from 0 to 100. A level above 70 is traditionally considered overbought – the area where traders start taking profits. At 67.7, Bitcoin is approaching this line but has not yet crossed it, leaving room to run before technical selling pressures intensify.
The vertical lines in the background in the Bitcoin chart above show the Squeeze Momentum indicator (which tells us when prices are compressing before a big rally in either direction), with positive momentum.
Predictions on countless
In Myriad, the prediction market I developed DecryptionParent company Dastan, traders are bullish on Bitcoin’s next major move. Currently, countless traders are placing 69% odds of Bitcoin reaching $84,000 Before it drops to $55,000. The gap in favor of the Bitcoin pump is the widest since the market debuted in early February.
But the same crowd is wary of timelines. A myriad of separate markets give Bitcoin only a 6% chance of reaching a new all-time high before July.
Overall, in an optimistic scenario, Bitcoin stabilizes above the broken trend line (now acting as support around $74,000-$75,000), and the ADX begins to rise above 20-25. If the bears take control again, a new rejection, combined with a pullback in the RSI from near overbought levels, will bring Bitcoin back to test the support zone. A break down turns the broken resistance back into resistance, negating the breakout.
Disclaimer
The views and opinions expressed by the author are for informational purposes only and do not constitute financial, investment or other advice.
Daily debriefing Newsletter
Start each day with the latest news, plus original features, podcasts, videos and more.


