

Bitcoin continues to recover from the recent sell-off, but the market remains trapped under a major resistance block that has capped every rally since the June crash. While short-term momentum has improved, Bitcoin is now approaching a crucial zone where the next move could determine whether the recovery develops into a larger trend reversal or remains a corrective bounce within a broader bearish structure.
Bitcoin price analysis: daily chart
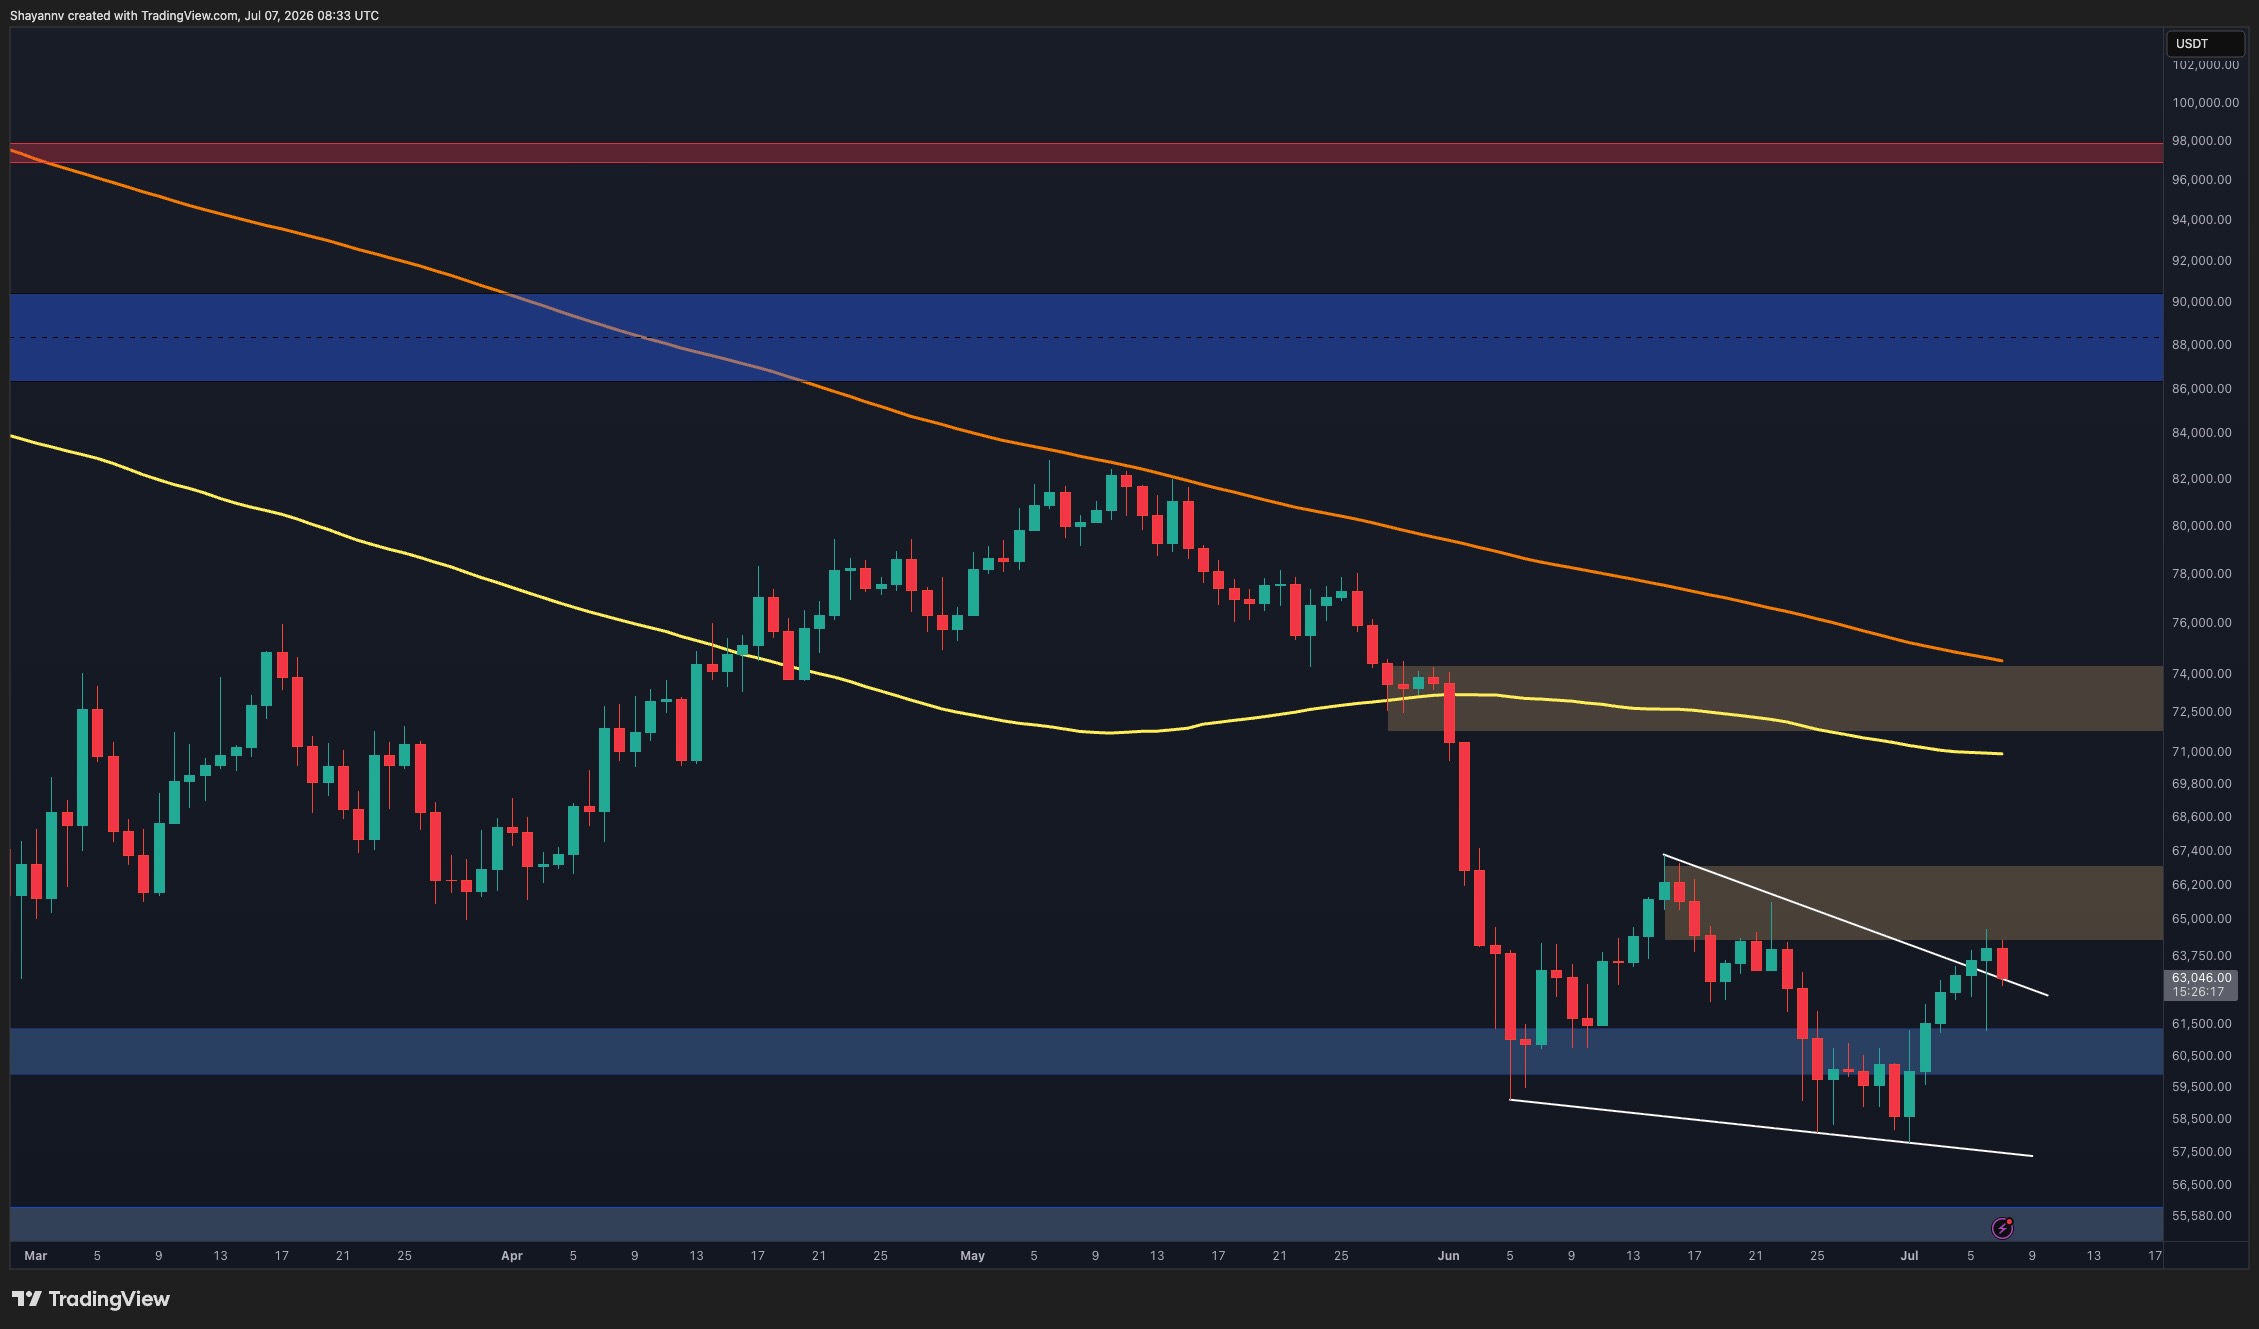
On the daily time frame, Bitcoin is still in a clear downtrend, trading below the 100-day and 200-day moving averages, both of which continue to trend lower. The recent recovery from the $58K-$61K demand zone has helped stabilize the price action, but the asset is still trading below the key resistance zone between $64K-$66.5K.
It has recently formed another higher low within the broader support area, while the RSI has continued to post higher lows despite the weakness seen throughout June. This developing bullish divergence indicates that the bearish momentum is fading and buyers are gradually regaining control.
However, the market structure remains bearish until Bitcoin can reclaim the $64K-$66.5K supply zone. This area corresponds to previous support turned resistance and continues to act as a major obstacle preventing a larger recovery. A successful break above this zone is likely to reveal the next major resistance near $72,000 to $74,000, while a rejection could take the price back towards the $60,000 support zone.
BTC/USDT 4-hour chart
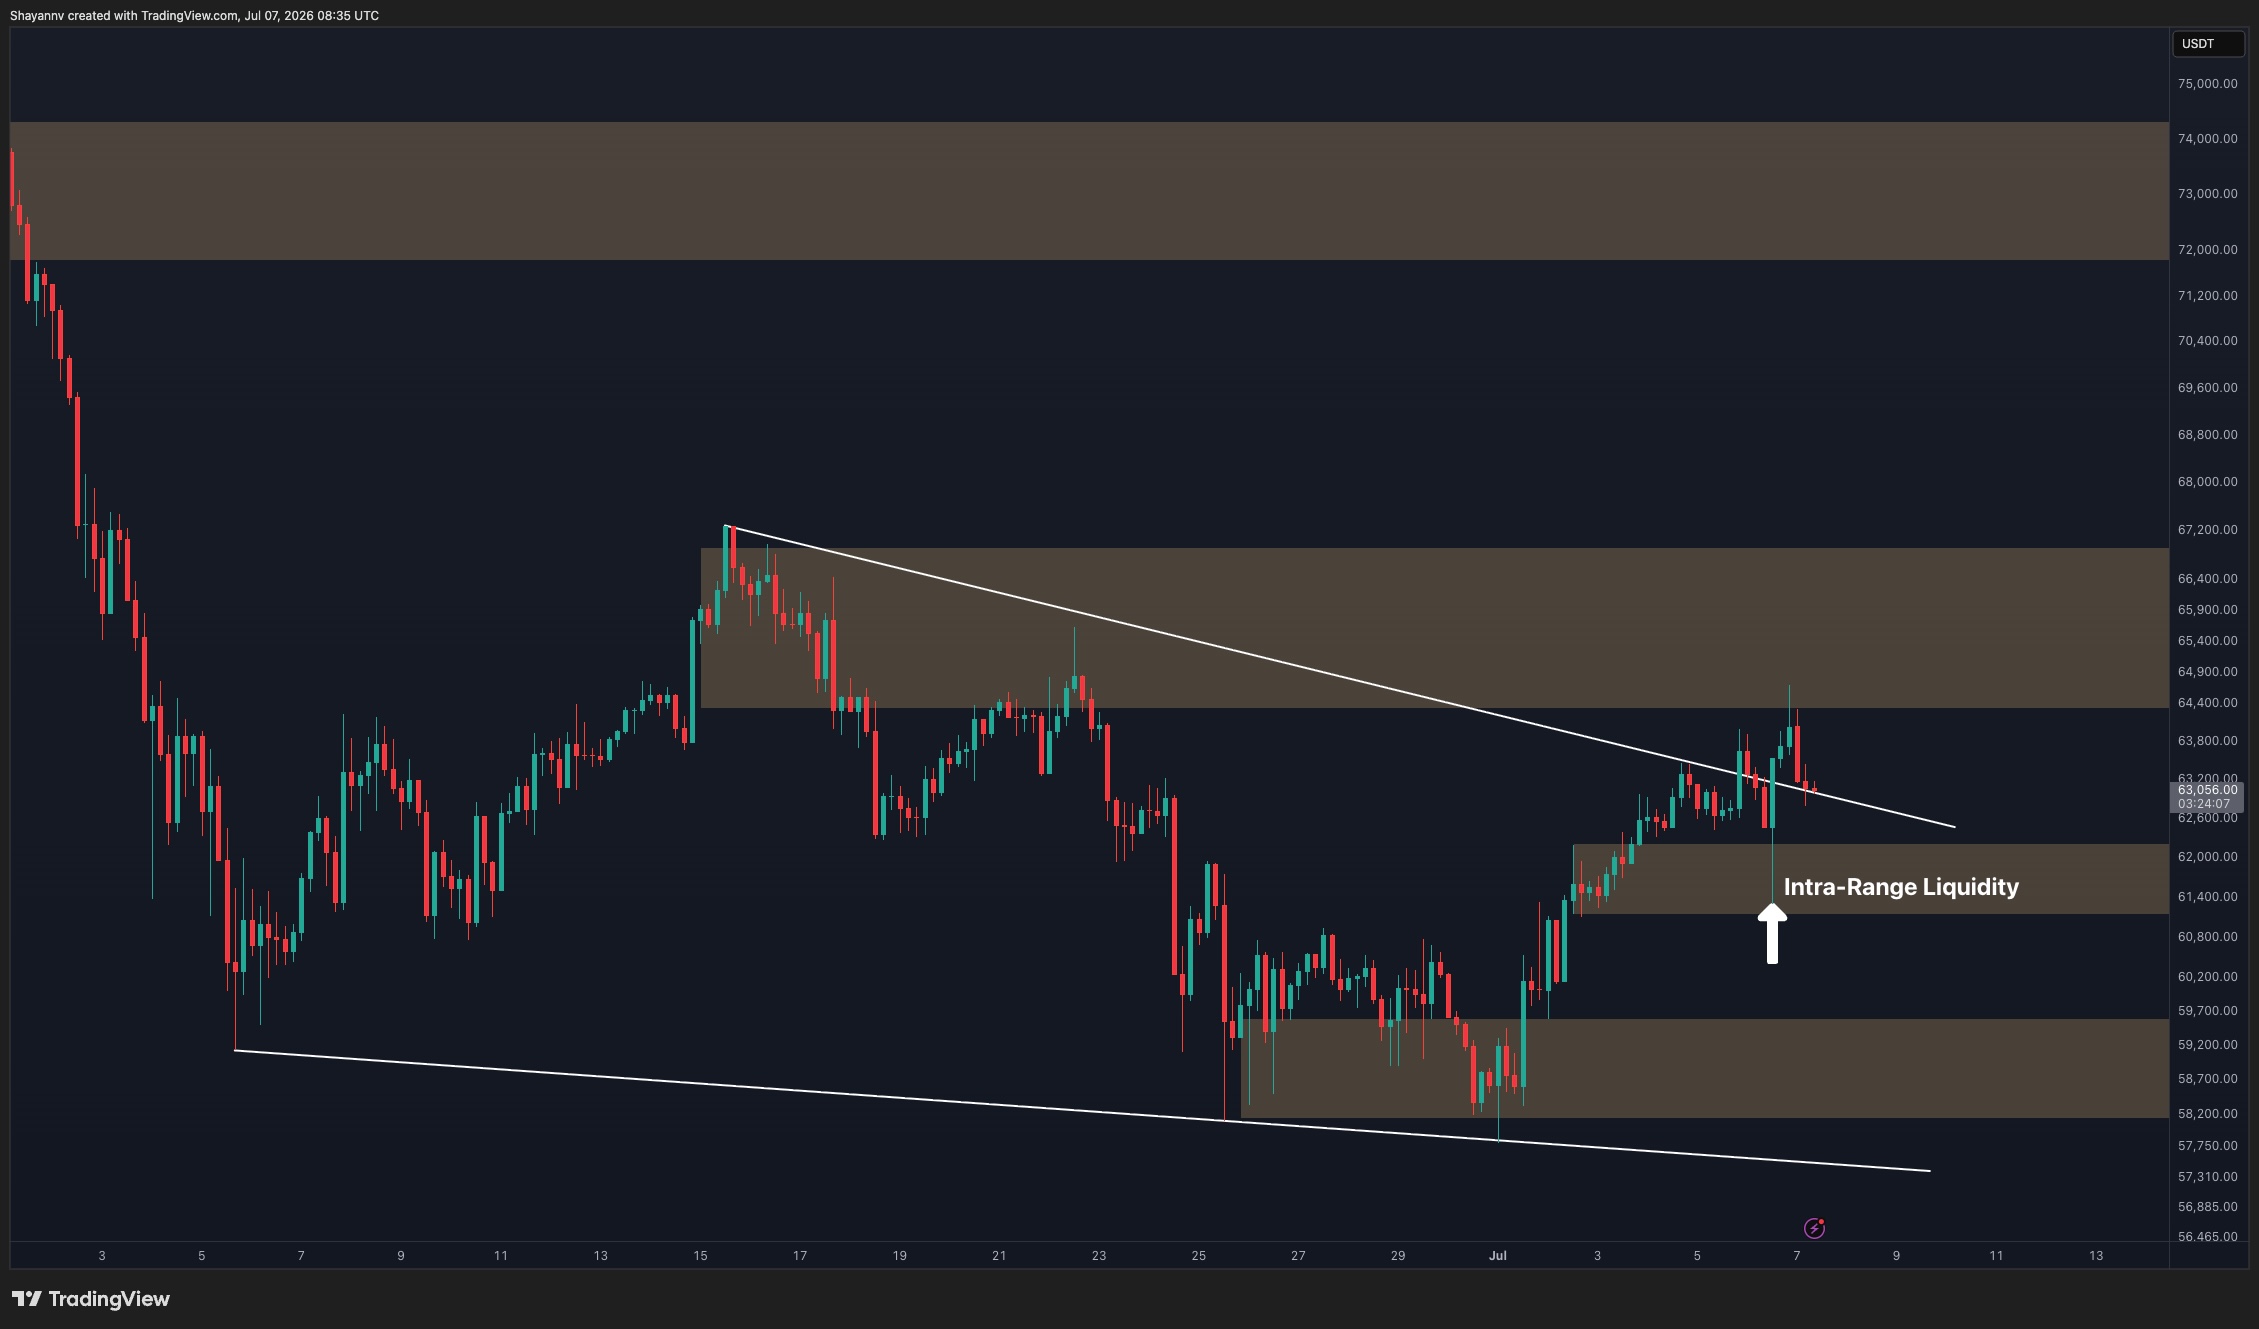
The 4-hour chart shows a more positive picture. After establishing a base around the $58K-$59K demand zone, Bitcoin produced a strong impulsive rally and broke straight into the downtrend line that has defined the corrective structure since mid-June.
The asset recently swept local liquidity above previous highs within the $61K-$62K area before encountering resistance near the downtrend line. This liquidity grab is important because it removed nearby buy-side liquidity and allowed the market to test a key technical level.
The current structure indicates that Bitcoin is trying to move from a series of lower highs to forming a potential breakout. A confirmed move above the downtrend line and $64K-$66K resistance zone would significantly improve the upside outlook and could accelerate the bullish momentum towards higher resistance levels.
Conversely, failure to break the trend line could lead to another period of consolidation between the $60,000 support level and the $64,000-$66,000 supply zone. As long as Bitcoin remains above the $60,000-$61,000 support zone, the structure of the short-term recovery remains intact.
Sentiment analysis
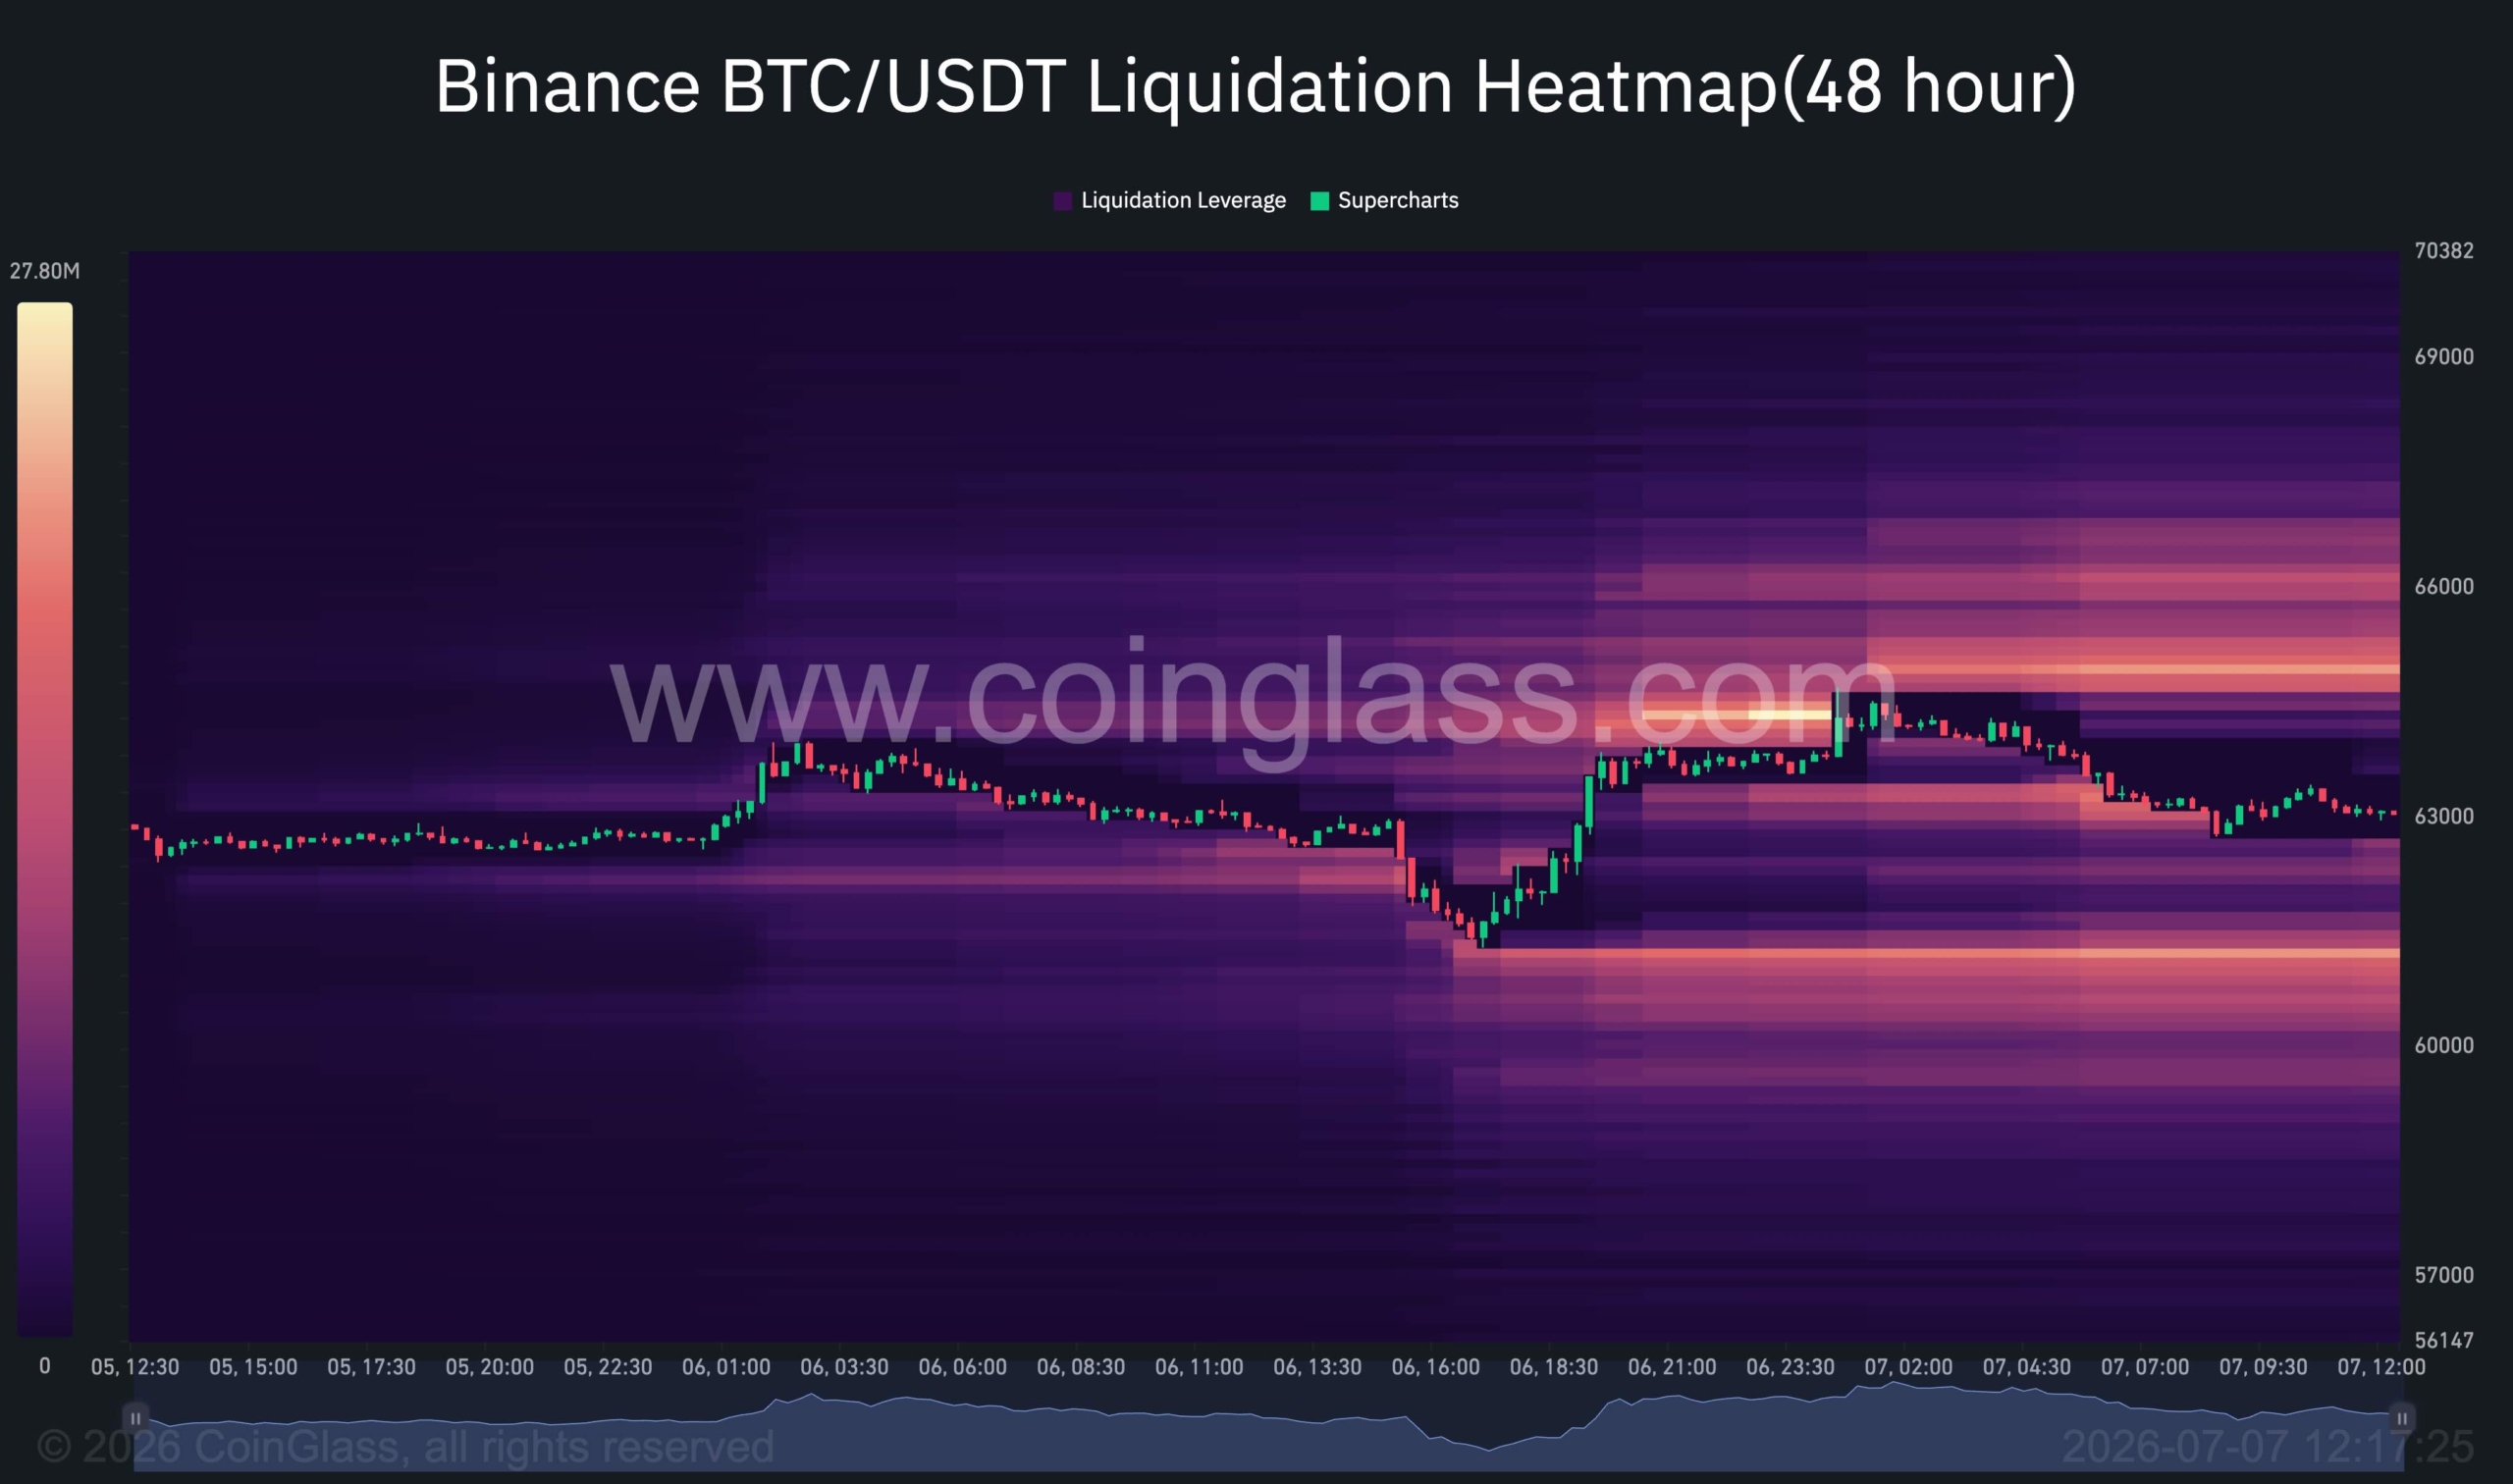
The 48-hour liquidation heatmap highlights a noticeable concentration of liquidity above the current market price, especially around the $64K-$66K region. This group is closely aligned with the resistance area identified on the 4-hour chart, reinforcing its importance as a major point of attraction for price action.
Importantly, the intra-range liquidity shown on the technical chart is also confirmed by the liquidation heat map. The recent push to the $61K-$62K area successfully targeted nearby liquidity within the range, validating the idea that the price was moving between pockets of liquidity rather than in a directional direction.
At present, the largest liquidation concentration remains near $65K-$66K, making it a logical target if buyers maintain momentum. Markets often gravitate toward these liquidity pools before the next directional move is identified.
If Bitcoin can sweep this overall liquidity and secure acceptance above the $64K-$66K area, this would strengthen the case for a broader recovery towards higher resistance areas. However, if this sweep is followed by rejection and an inability to hold prices above resistance, the move could simply represent a liquidity-driven rally before another test of lower support levels.
Currently, both the technical structure and liquidation data suggest that the path of least resistance remains slightly higher, with the general liquidity pool being the most likely destination in the near term.
this post Bitcoin Price Analysis: The structure of BTC remains bearish until this key level is reclaimed appeared first on CryptoPotato.