

Bitcoin is trading at around $76.2K, hitting its highest price since the February crash and officially entering the $75K-$80K resistance range that defined the recent consolidation ceiling. The move represents a tangible escalation in the recovery, with BTC now breaking above the down channel and the 100-day moving average simultaneously, which could be a very bullish sign if it continues in the coming weeks.
Bitcoin price analysis: daily chart
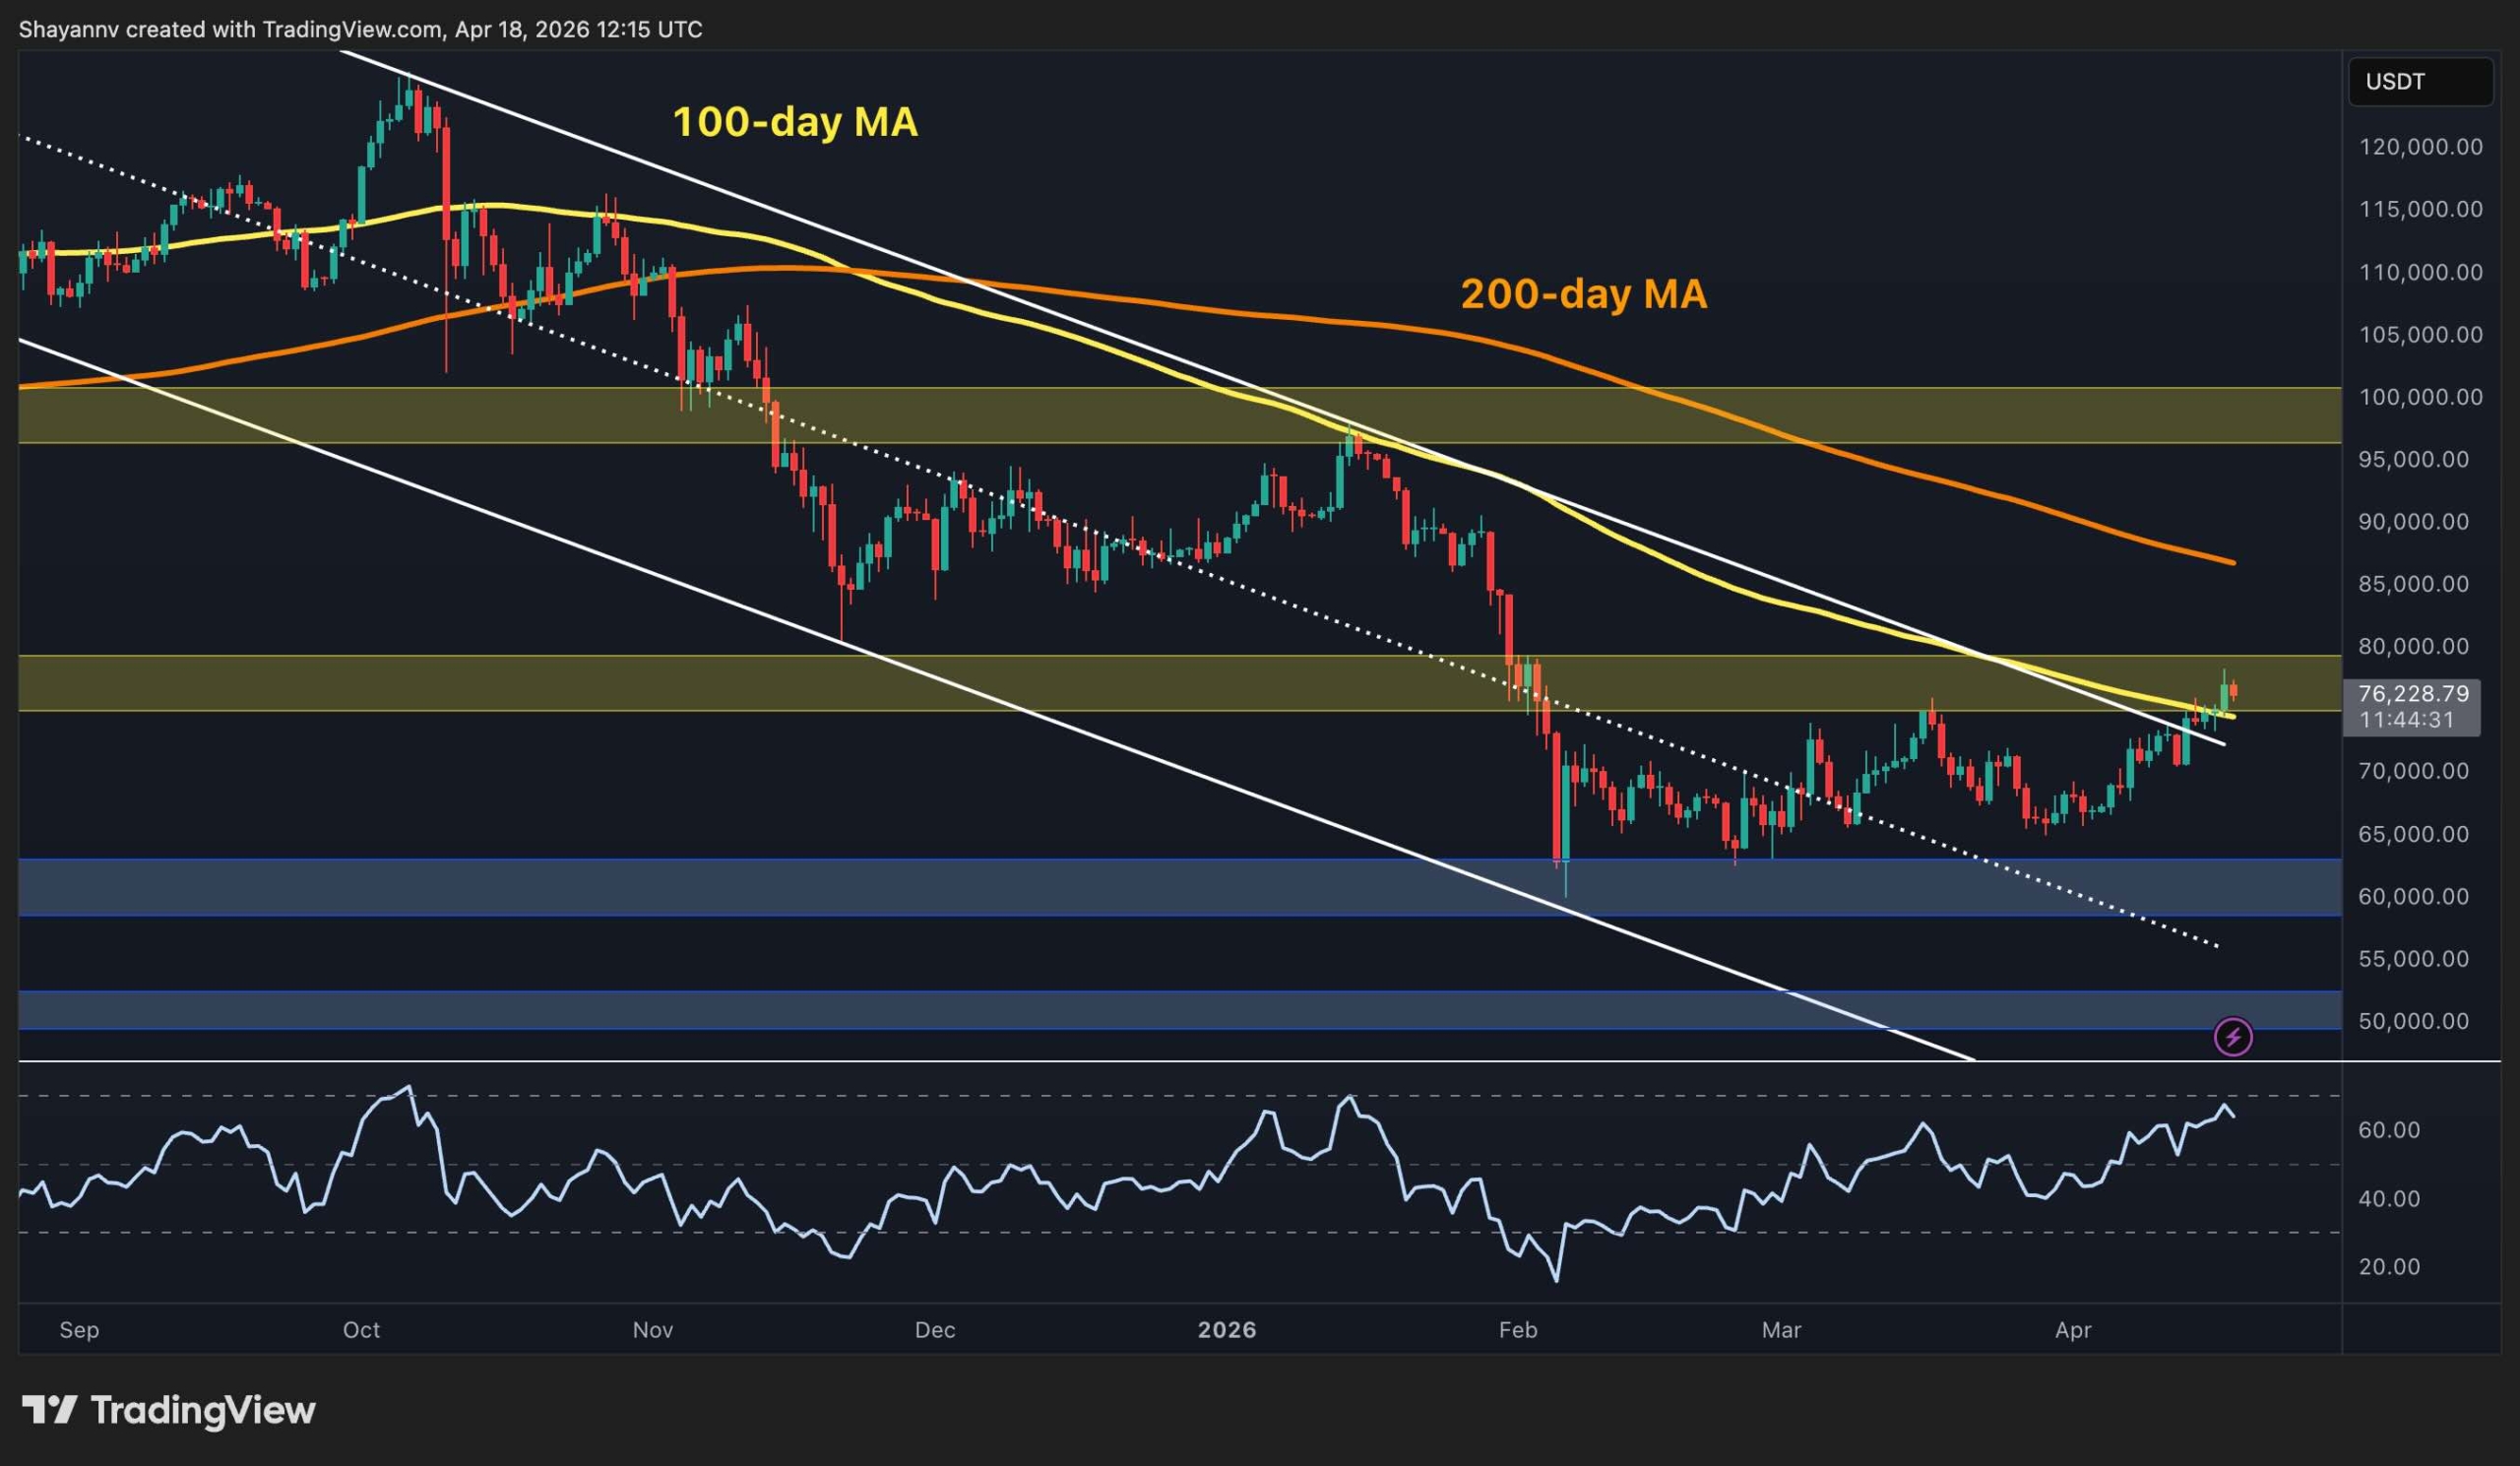
Bitcoin (BTC) has decisively broken above the upper border of the descending channel and the 100-day moving average (around $75K) on the daily chart. The Relative Strength Index is now above 60, showing its highest reading since January when Bitcoin was trading around $95,000. This is the most constructive daily setup of the past couple of months, and for the first time, the technical weight of the evidence is starting to tip in favor of the buyers rather than simply indicating seller exhaustion.
The immediate focus turns to whether BTC can close above the $75k-$80k resistance area and identify it as a support level. This area could serve as key ground for the coming months, and restoring it on a sustainable basis would be a major structural development. Above it, the 200-day moving average (around $86K-$87K) and the critical supply zone between $95K-$100K represent the next major hurdles. On the downside, the previous upper boundary of the channel can be relied upon for a retest and bounce, with the $60,000 area considered as the deeper floor.
BTC/USDT 4-hour chart
On the 4-hour chart, Bitcoin briefly pushed through the upper border of the bullish channel earlier in the week, reaching the $78,000 mark before pulling back inside the channel. The price is now just below the upper border, a pattern that often reflects a short-term consolidation or correction after a failed breakout.
The RSI in this time frame has also retreated from the overbought zone but has not yet indicated a trend reversal. A combination of $74K-$75K followed by a revolving payment would be the ideal structure for buyers. However, a breakdown back below the recent structural bottom near $74K would be more worrying and would call for a reassessment of the short-term outlook, as it signals a potential bearish shift in the market on the 4-hour time frame.

On-chain analysis
The Bitcoin Coinbase Premium indicator has convincingly flipped into positive territory, currently reading around +0.03. This is the first notable positive reading since the correction accelerated in late 2025. After months of deeply negative prints that characterized the February crash period, where the index fell towards -0.20, the turn to green reflects a tangible change in the behavior of US-based buyers on Coinbase.
The timing aligns perfectly with BTC breaking above the descending channel, suggesting that the move is supported by real US demand and not driven solely by offshore or derivatives activity. During the 2025 bull run, Coinbase Premium remained consistently positive throughout the bull run.
While one week of positive readings does not recreate this dynamic, the trend shift is noticeable. If the premium continues to consolidate and hold above zero while pushing the price into the $75K-$80K resistance band, it will add meaningful conviction that this recovery has institutional support rather than being purely technical driven.

Free Binance $600 (CryptoPotato Exclusive): Use this link To register a new account and get an exclusive welcome offer of $600 on Binance (Full details).
Limited offer for Bybit’s CryptoPotato readers: Use this link To register and open a free position worth $500 on any currency!
Disclaimer: The information contained in CryptoPotato is that of the cited authors. They do not represent CryptoPotato’s opinions on buying, selling or holding any investments. We advise you to conduct your own research before making any investment decisions. Use of the information provided is at your own risk. See our disclaimer for more information.


