
Bitcoin’s price rebounded 2.8% from an intraday low of $62,850 to around $64,650 on July 29 as traders braced for the Federal Reserve’s interest rate decision.
summary
- Bitcoin rebounds 2.8% After buyers defended the 200-day EMA near $62,850.
- The immediate resistance area remains between $65,000 and $65,200Boosted by the 4-hour Supertrend indicator.
- Traders have bought $2.5 billion in Bitcoin call spreads Targeting a move towards $72,000.
- A A rejection of less than $65,000 may offer $62,000 to $62,500. As outflows from ETFs weaken spot demand.
Bitcoin price recovers ahead of Fed decision
According to data from crypto.news, Bitcoin (Bitcoin) The price rose from $62,850 to an intraday high near $64,775 before settling at around $64,650. The rebound came after several sessions of selling across cryptocurrencies and technology stocks.
The low of $62,850 is in line with Bitcoin’s 200-day moving average, making this level an important test of the broader market structure. Short-term momentum indicators have also entered oversold territory after BTC fell from last week’s high near $66,700.
Buyers entering around the long-term average helped spur a quick return towards $64,500. Short sellers who opened positions during the decline may have also contributed to the rebound by closing trades as the price of Bitcoin rose.
Bitcoin’s relative strength was notable as Asian technology stocks remained under pressure. Shares of SK Hynix fell sharply after its earnings beat high market expectations, contributing to a broad sell-off in stocks related to chips and artificial intelligence. South Korea’s Kospi fell 6%, while pressure also extended to several US semiconductor names.
BTC traded closely with AI-related stocks during most of July. Its rebound during the latest tech rout suggests that short-term crypto selling pressure may be easing, although a single session is not enough to create a permanent decoupling.
FOMC positioning could pinpoint a breakout of $65K
The Fed’s decision is the main catalyst facing Bitcoin. Markets had mostly priced the federal funds rate unchanged, but swap pricing indicated a roughly one in three chance of a 25 basis point increase before the announcement.
Citadel Securities said the Fed may raise interest rates to respond to persistent inflation. Such an outcome would likely boost dollar and Treasury yields, creating another hurdle for Bitcoin and other risky assets.
Holding interest rates may reduce immediate pressure, but the market will also track the Fed’s statement and comments from Chairman Kevin Warsh. A suspension accompanied by inflation warnings could limit Bitcoin’s upside, while a softer policy outlook could help BTC cross $65,000.
The July 31 Bitcoin options expiration holds approximately $9.61 billion in notional open interest, with calls representing 116,260 BTC and maximum pain at $64,000.
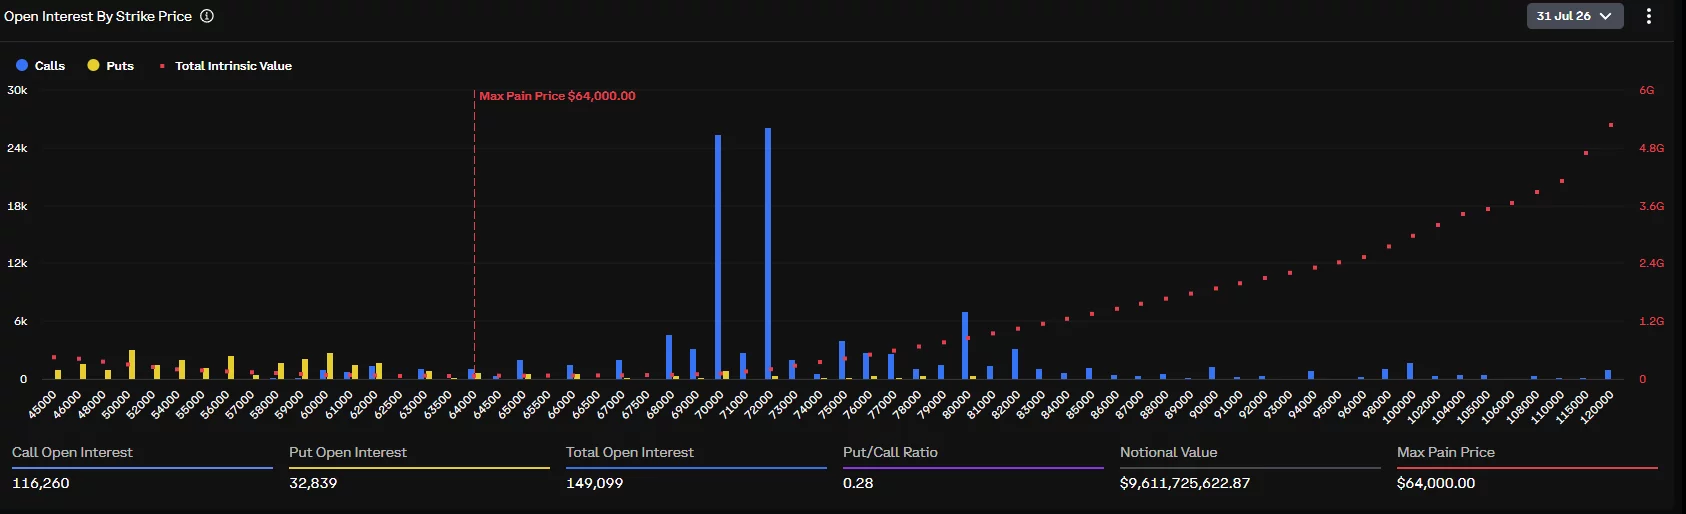
Call-heavy positioning does not guarantee a spike. However, a break above nearby resistance could prompt traders to rebalance their hedges and force short sellers to cover, potentially fueling a post-FOMC move.
Bitcoin should close above $65,200
Bitcoin’s 4-hour chart shows that the recovery has not yet reversed the short-term bearish setup. BTC remains below Supertrend resistance at around $65,198, making the $65,000-65,200 range the first confirmation level for buyers.
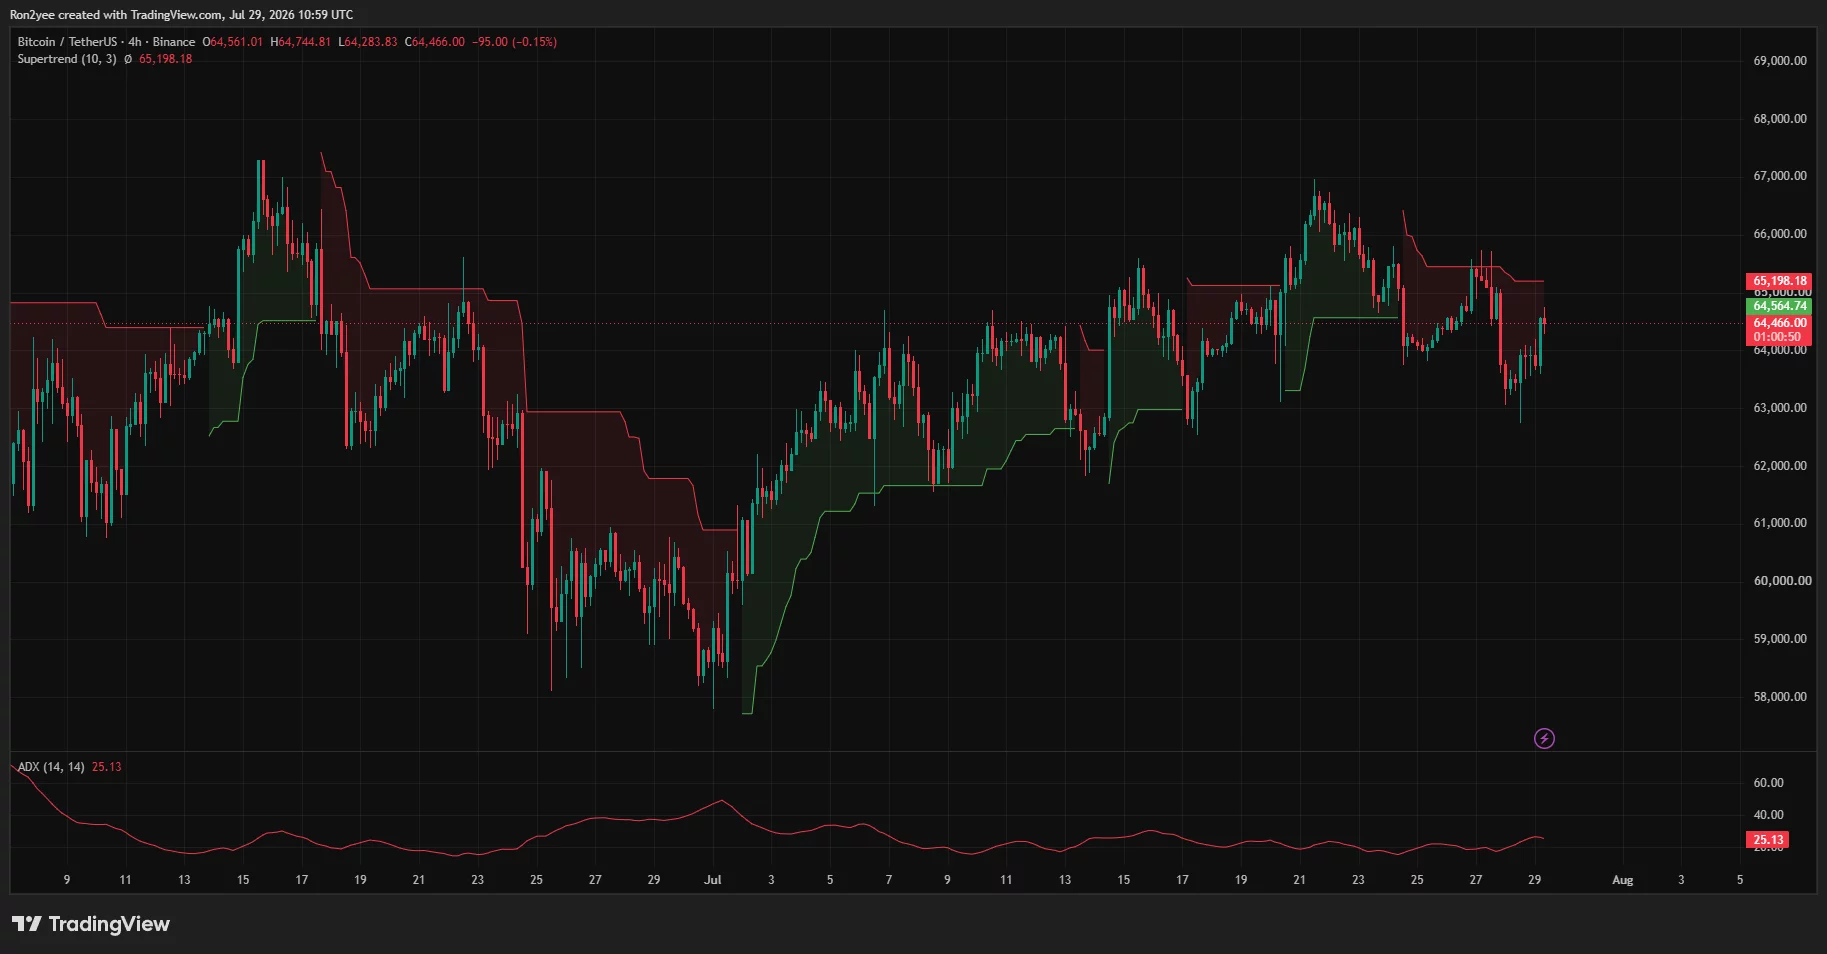
The average trend index is 25.13. A reading above 25 indicates that the next trend movement could develop enough strength to expand, but the indicator does not determine whether that movement will be bullish or bearish.
A 4-hour close above $65,200 will weaken the current sell signal and expose between $65,800 and $66,200. Bitcoin would then need to surpass $66,700, the previous weekly high, to establish a stronger sequence of higher highs.
The Ichimoku daily chart represents another hurdle. Bitcoin is trading near the lower edge of the cloud at around $64,490 and below the conversion line near $64,849. A daily close above this area would improve the short-term outlook, but the asset still needs to move through the broader cloud before a sustainable trend reversal is confirmed.
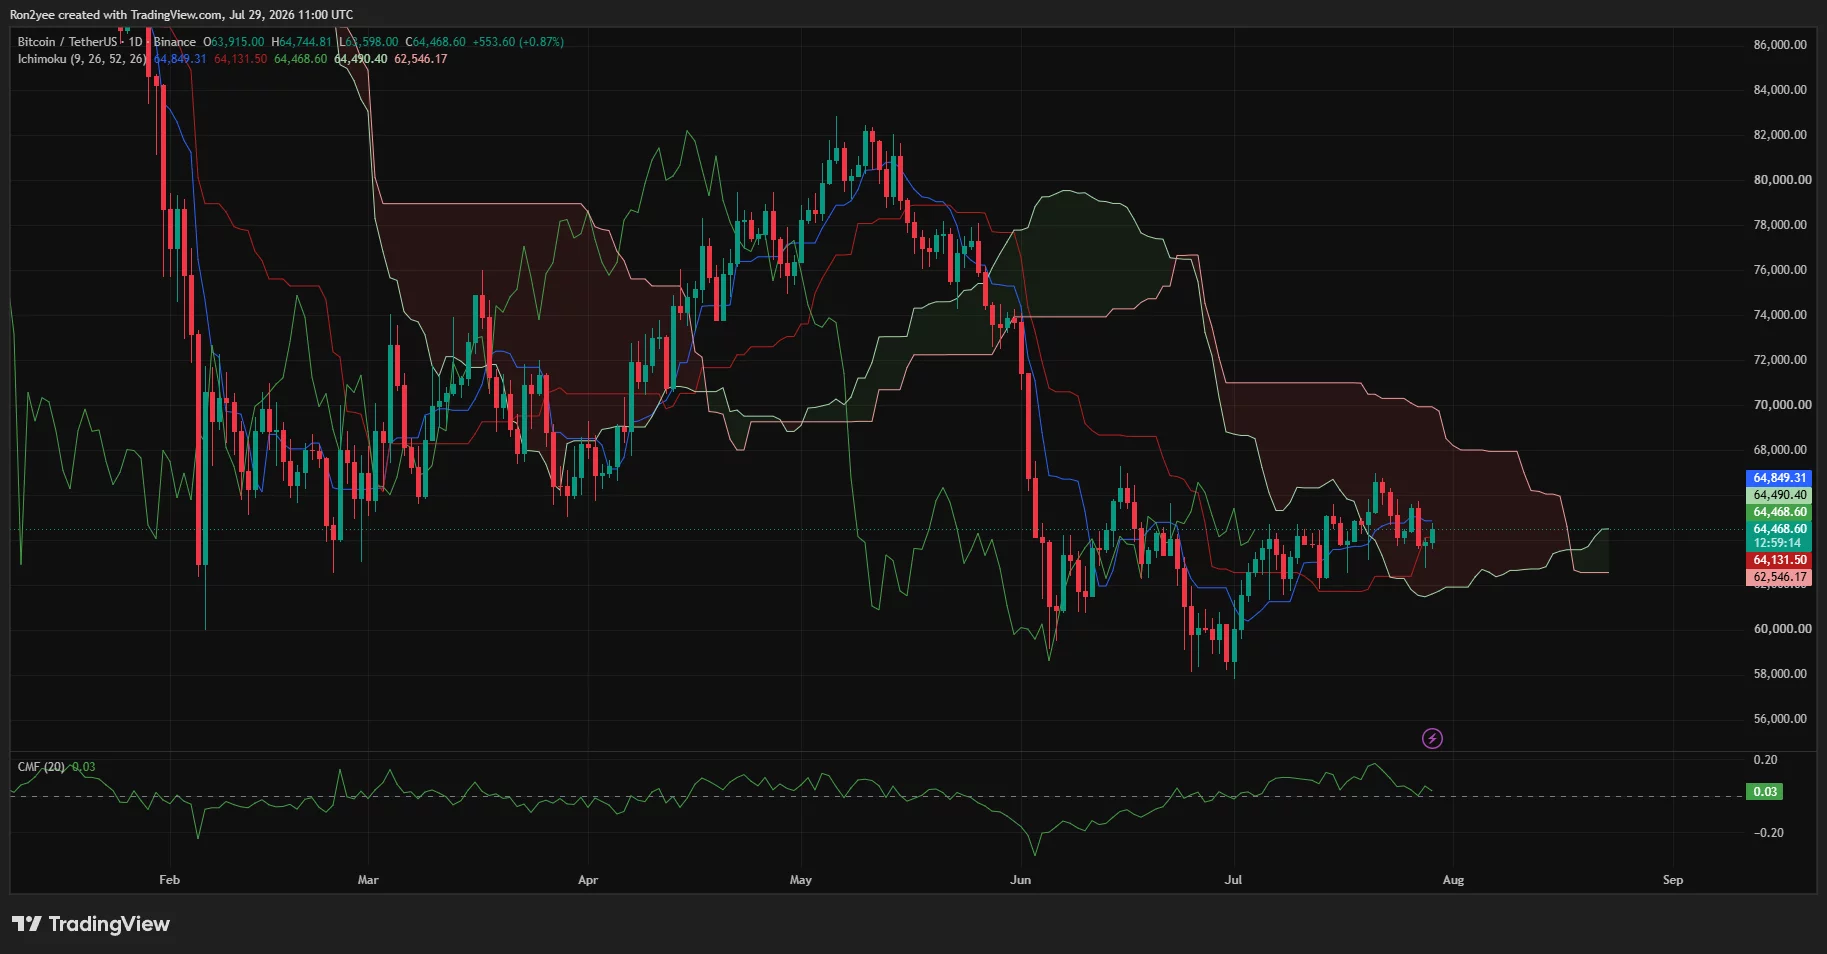
Chaikin Money Flow is positive at 0.03, indicating that buying pressure has returned modestly. But the reading is still close to zero, and does not yet indicate a strong accumulation.
Liquidation combinations leave BTC exposed in both directions
CoinGlass’ three-day liquidation heat map shows a dense liquidity range between $64,400 and $64,700, where Bitcoin was trading at the time of the chart. This near-focus may contribute to volatile price swings before and immediately after the Fed announcement.
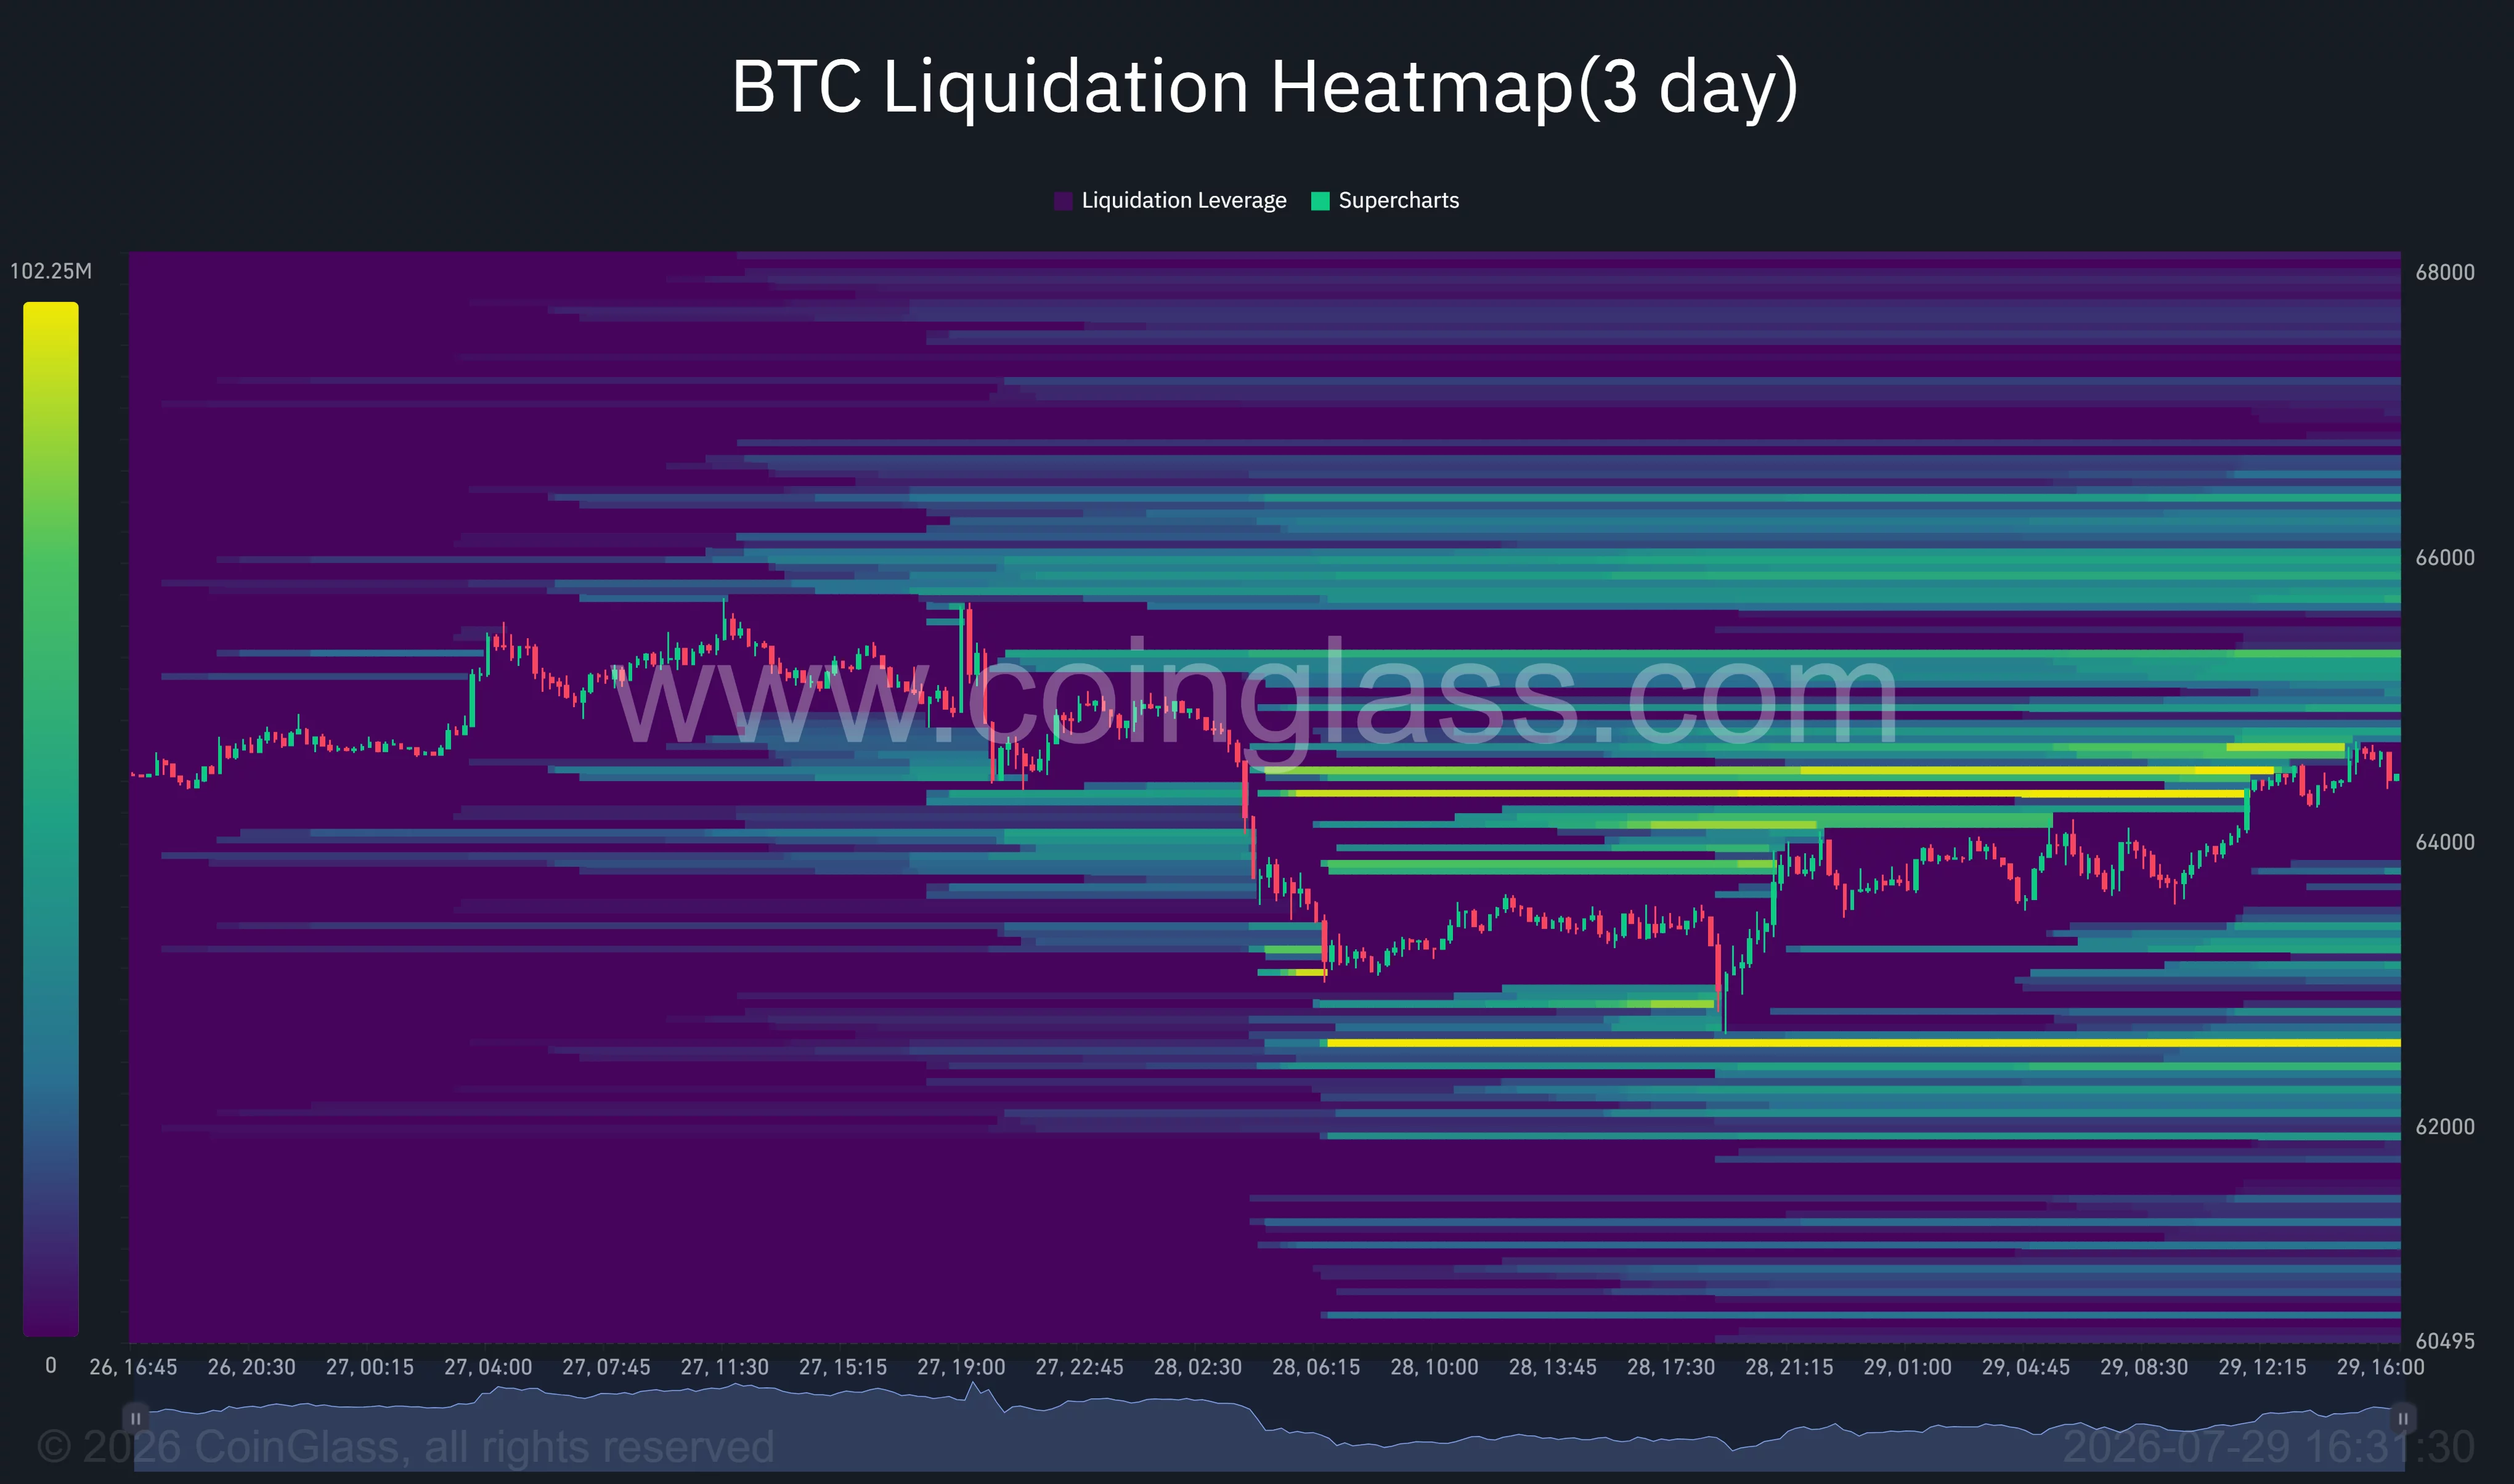
More liquidity can be seen near $65,000-$65,300, followed by a larger group of trades around $65,800-$66,200. Therefore a confirmed break above $65,200 could drag Bitcoin towards these higher liquidation levels as bearish positions are forced to close.
The downside has a similarly important focus near $62,500. A loss of $64,000 would increase the risk of another test of $63,000, followed by the support area between $62,000 and $62,500.
Cryptocurrency analyst Ted Bellows, too It has been identified $65,000 is a critical level in the near term. He warned that failure to recover it could send Bitcoin back to between $62,000 and $62,500.
Michael van de Poppe offered a more optimistic assessment, calling the recovery a “very strong bounce” and arguing that Bitcoin could continue to rise if it maintains its recent strength.
ETF flows and US politics continue to represent downside risks
Spot demand for Bitcoin ETF in the US remains an important weakness behind the current setup. More than $500 million worth of product reportedly left during the 4-day period of outflows, removing a source of immediate demand that had supported the previous advance.
The FOMC findings will directly impact US investors because higher interest rates increase the relative attractiveness of money and short-term government debt. A spike could also raise funding costs and reduce demand for leveraged cryptocurrency positions.
Stalled cryptocurrency legislation in Washington adds another source of uncertainty. Polymarket traders recently put forward the possibility of the CLARITY Act becoming law in 2026 By approximately 34%down from higher levels earlier in July. The bill has faced controversies over ethical restrictions and provisions regarding stablecoins.
Bitcoin could reach the $65,000 level if the Fed avoids a hawkish surprise and buyers secure a close above $65,200. However, without renewed inflows from the ETFs, the move will remain dependent on derivatives positioning and short covering, leaving $62,500 exposed if the breakout fails.
Disclosure: This article does not constitute investment advice. The content and materials contained on this page are for educational purposes only.