
Silver (XAG/USD) is trading near $79 after a 3% intraday jump cleared a multi-month shelf of resistance, with the dollar simultaneously sliding inside its downward channel.
The setup combines a structural pattern, an inverse macro move that is weakening consolidatively, and a futures positioning reading that indicates a quiet but sustained upside bias. Silver’s ability to chase its all-time high at $121.65 depends on which signal will prevail.
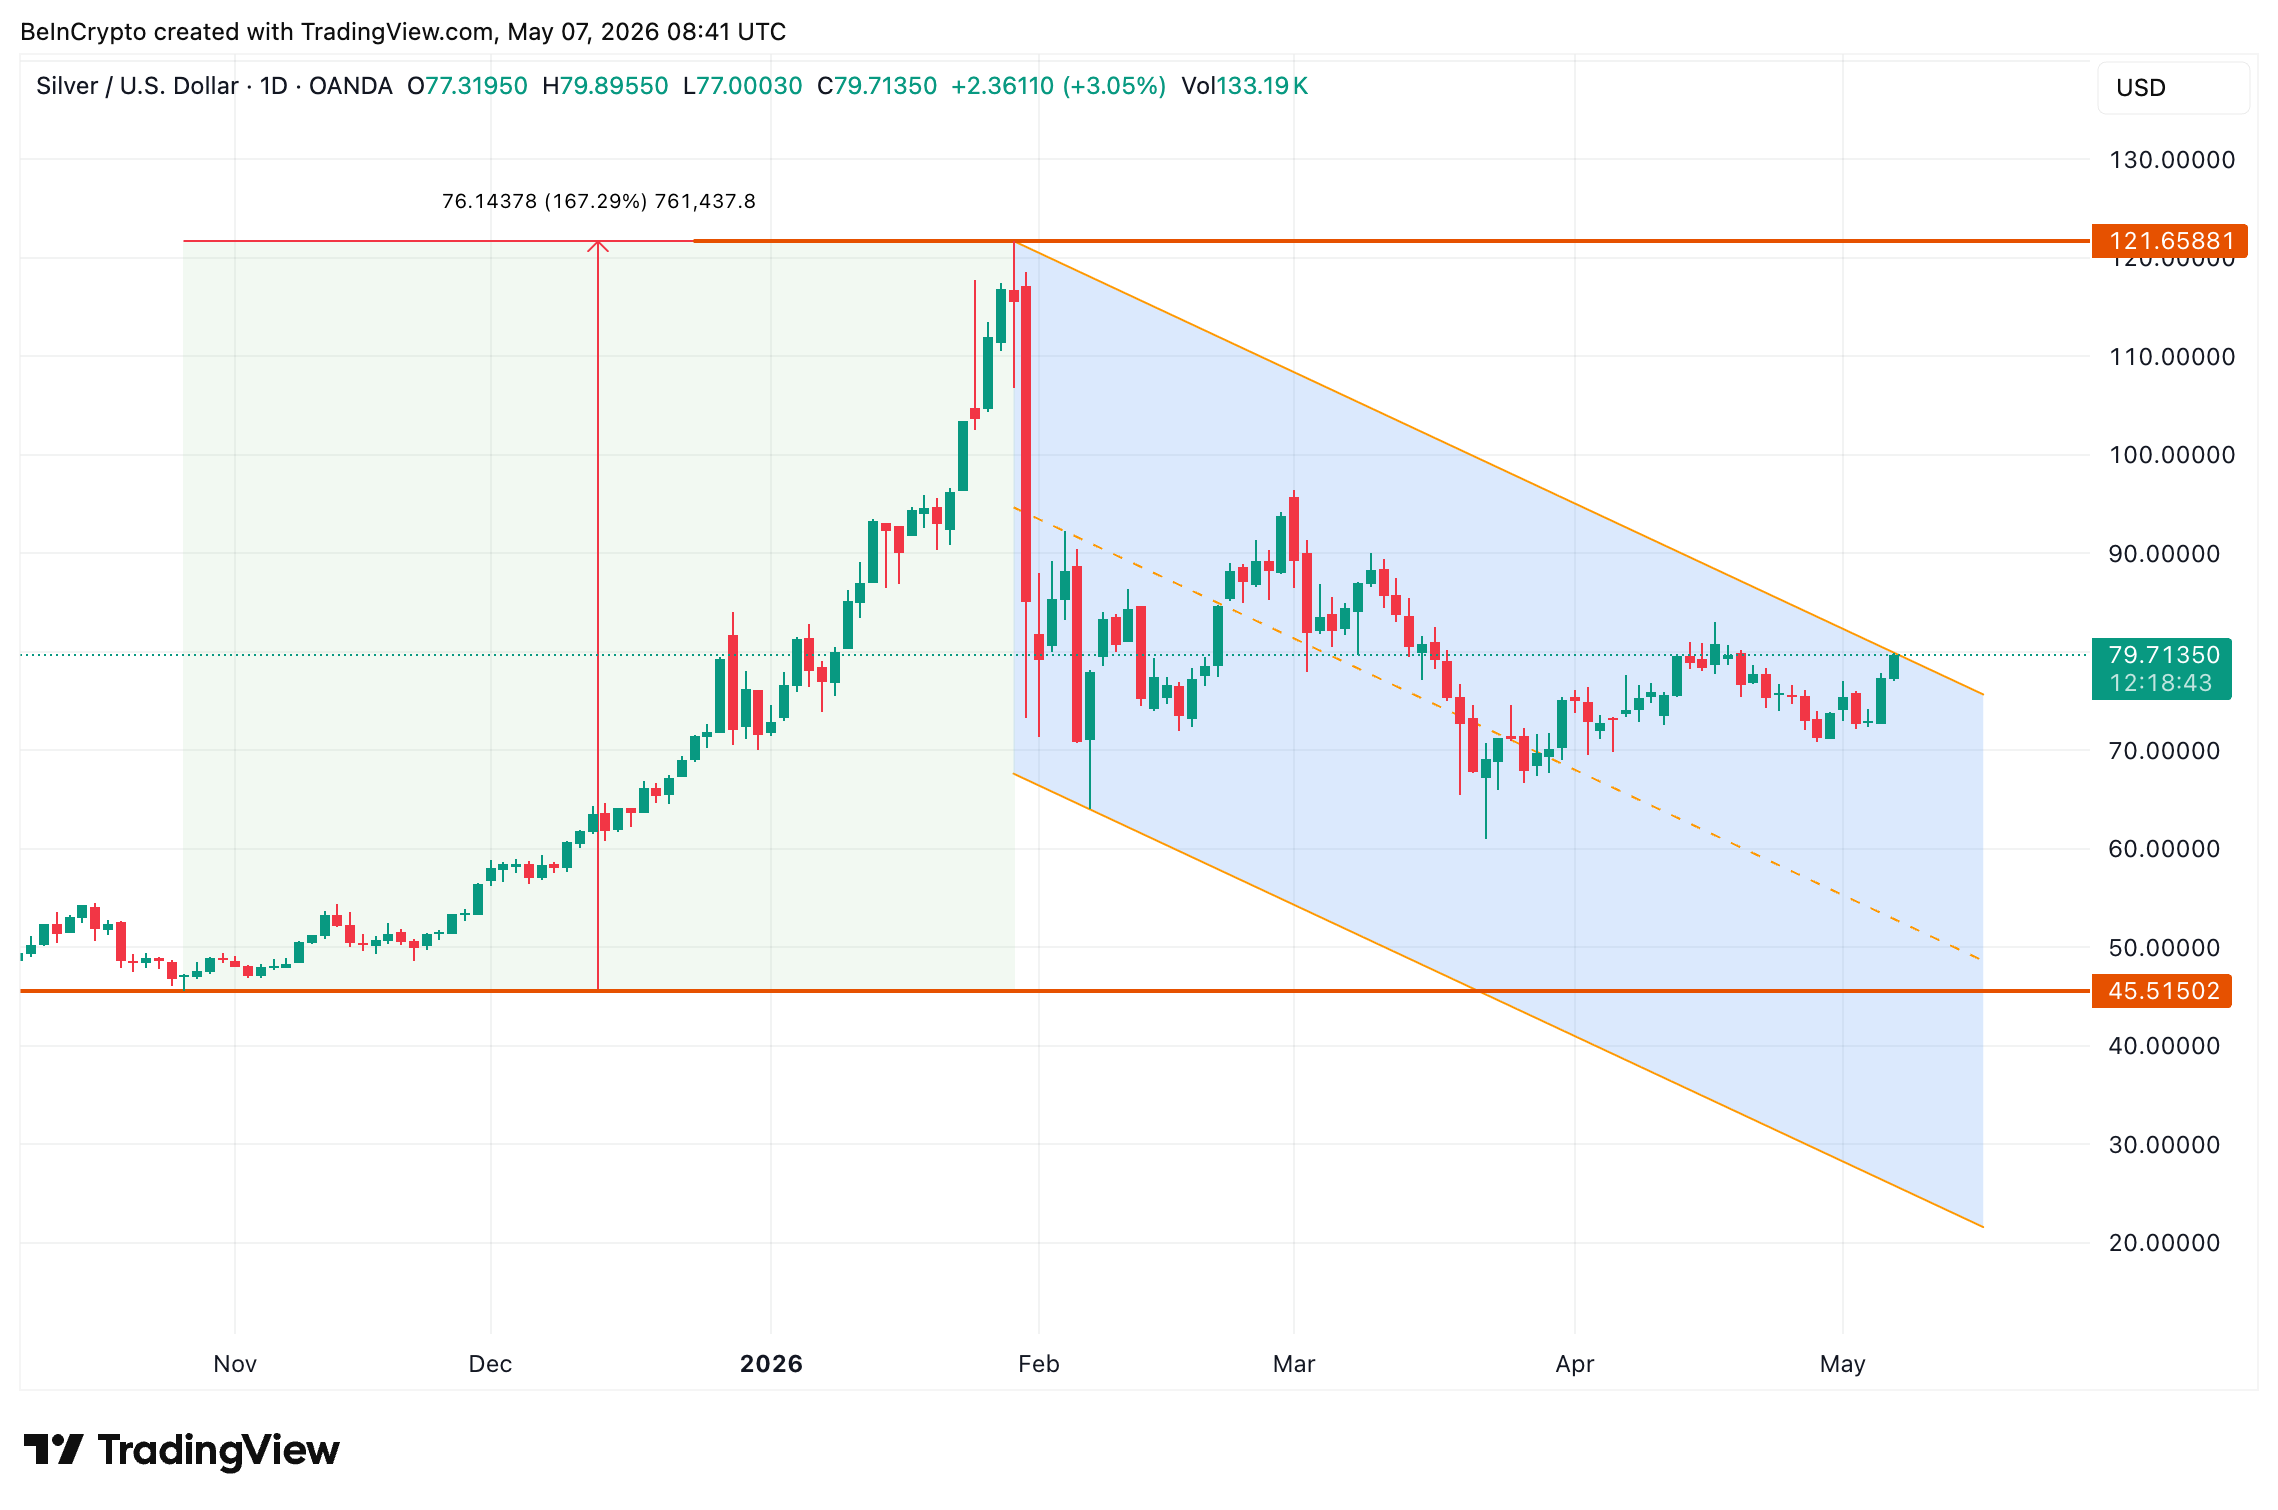
Silver builds continuity of setup after a 167% rise
Silver rose 167% from the October 2025 low of $45 to the all-time high of $121 in late January. Since that peak, the metal has been trading within a descending channel, which is a structural pattern bounded by two parallel descending trend lines.
Want more ideas like this? Sign up for Editor Harsh Notariya’s daily newsletterhere.
Bearish channels are not always bearish. When they form after an extended rally, they often resolve as continuation patterns. The structure represents a pause before the previous trend resumes.

Today’s session pushed silver to rise by about 3%, reaching approximately $79. The move broke above the multi-month resistance shelf that capped all previous rally attempts. The resistance rack will be revealed later in this piece. For now, the next hurdle will be the upper trend line of the channel. If this is broken, the bullish continuation of silver (XAG) could resume.
A breakout signal is technically clean, but a one-day move doesn’t mean much without macroeconomic support. The dollar’s path is the biggest driver.
Dollar weakness builds case for silver rally
The US Dollar Index (DXY) has been declining since early April. The index tracks the dollar against a basket of major currencies.
Silver and the dollar are moving inversely. A weak dollar makes silver cheaper for foreign buyers and boosts demand in emerging markets. It also reduces the opportunity cost of holding non-yielding assets.

The dollar’s decline was reinforced by macro developments. On May 6, Brent and WTI crude oil prices fell 7% to 8%. The selling was driven by optimism about the US-Iran agreement that could reopen the Strait of Hormuz.
A final agreement would reduce demand for the dollar as a safe haven and accelerate the weakness of the dollar index. Also, if the DXY weakens another 1.55%, a channel breakdown could help silver further.
However, whether the dollar decline will be priced in depends on positioning at the futures level.
The COT report shows cautious deleveraging with an upward bias
The Commodity Futures Trading Commission’s latest Commitments of Traders (COT) report was released on April 28. The report shows that traders are reducing exposure to silver across the board.
Total open interest, i.e. the number of futures contracts outstanding, decreased by 14,187 to 101,275. Both longs and shorts were reduced, but the shorts came in faster. Non-commercial speculators reduced their long positions by 1,919 contracts and short positions by 2,359 contracts. Shorts unpack approximately 23% faster than long shorts.

Net speculative positions remain structurally long with a 4.4 to 1 long to short ratio (31,314 vs. 7,154). Commercial hedgers remain heavily short at 69.2% of open interest. This is normal because they are hedging physical inventory.
Traders are reducing risk, but the marginal flow is bullish. Shorts exit faster than long trades. With the overall chain aligned and positioning, the silver price ladder reveals the actual path to the all-time high.
Silver Price Levels: Way back to the all-time high of $121
Silver just broke out Above $78, which is the 0.236 Fibonacci level. This level has served as a resistance shelf for several months.
A sustained retracement opens the $90 level (0.382 Fib), where the upper channel trend line breaks significantly. Above $90, the next test is $99 (0.5 Fib). This represents an increase of 24% from the current price.
The $99 level is crucial. Silver attempted several rallies after its peak in late January but failed to clear the $99 level in each attempt. Its recovery would mark the first decisive break in the post-ATH structure.

Above $99, the path opens to $108 (0.618 Fib), $120 (0.786 Fib), and an all-time high of $121. This move represents a 53% upside from the current price. However, whether this level appears in May depends on how the COT position and DXY movement develop during the month.
The negative ladder is narrower. Failure to hold $78 keeps silver in the channel. A slide towards $64 and $60, the lower range of the channel, becomes the next risk. A break below $60 would weaken the entire continuation thesis. Currently, $99 separates the silver price of $121 from a slide to $64.
this post Can silver reclaim its all-time high of $121 before the end of May? appeared first on BeInCrypto.


