

US stock markets opened with strong optimism, but other asset classes are not as confident.
While stocks rise and catch up with futures’ rise in the previous session, currency and commodity markets remain cautious on unresolved issues in recent diplomatic talks.
The overall geopolitical outlook looks positive, with both sides agreeing to reopen the Strait of Hormuz within the next 30 days and working toward a long-term peace process within 60 days.
However, reaching a final agreement is difficult. Reports indicate that Iranian negotiators are still stuck on key issues, especially the release of frozen funds and where Tehran’s enriched nuclear stockpiles will go.
Ongoing diplomatic tensions are causing a rapid shift in commodities, leading to a rebound in crude oil prices, especially Brent.
Persistent geopolitical risks and concerns about inflation are providing strong support for the US dollar, which is the subject of analysis this morning.
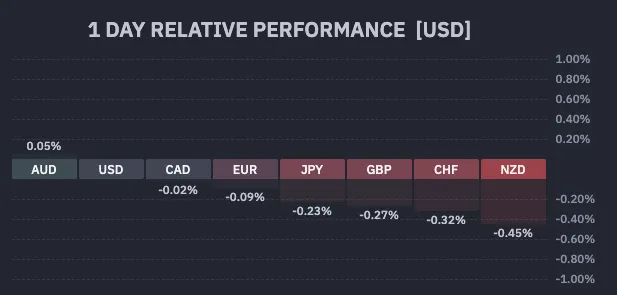
Forex performance during the current session – Courtesy of Finviz. May 26, 2026.
Although peace hopes are pushing risk assets to new highs, the US dollar remains strong, which goes against the broader trend.
We will look at the Dollar Index, EUR/USD, and GBP/USD to see how the recent peace flows have already affected the FX market and where to look next.
4-hour dollar index chart
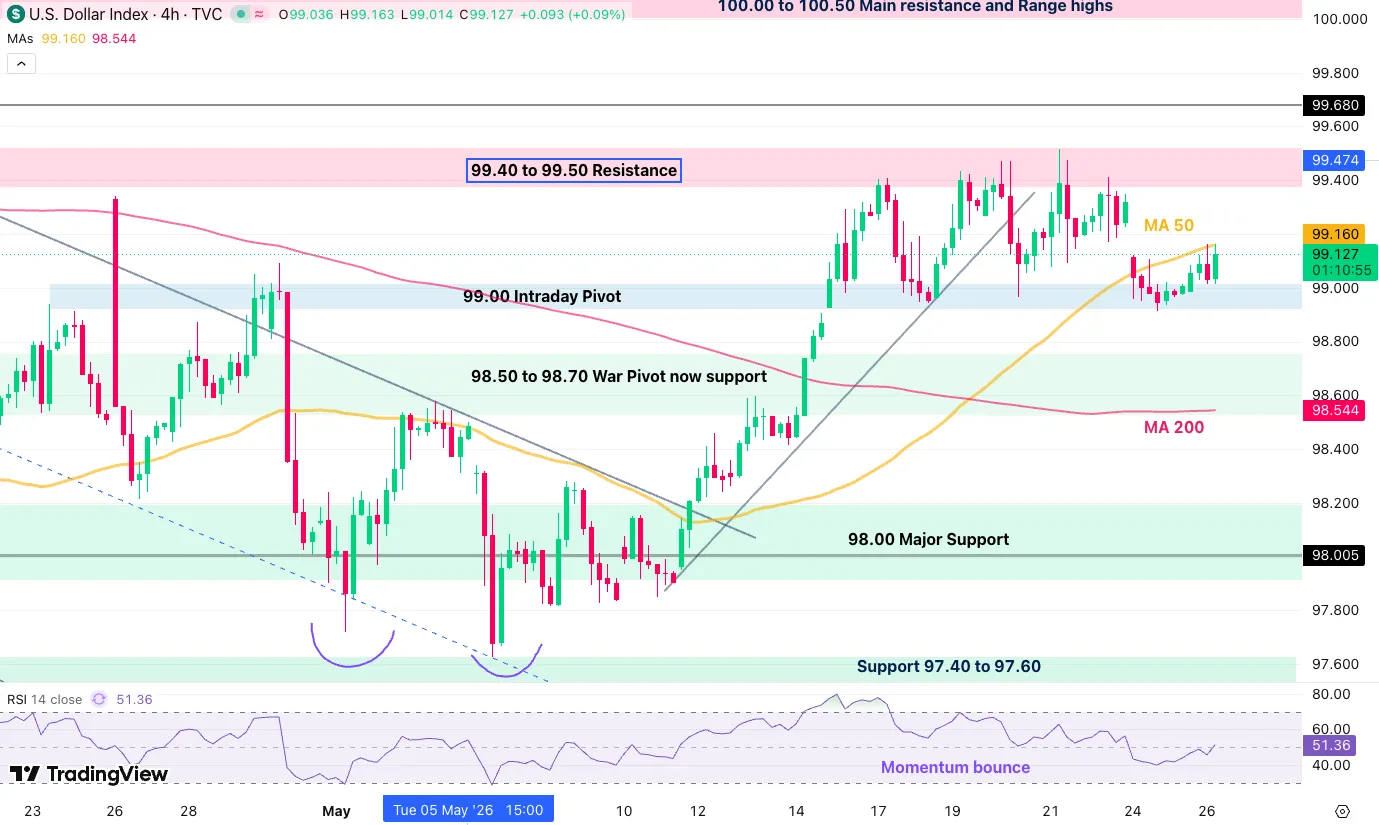
Four-hour dollar index chart, May 26, 2026 – Source: TradingView.
The US dollar is It is currently consolidating between 99.00 and 99.50This is a much higher range compared to late April trading, when it was closer to 98.00.
The bulls are pushing the price action above the 4-hour and 50-period moving average, indicating a potential test of the upper boundary of the range.
With RSI momentum also rising, the setup looks more bullish for the US Dollar. Watch the reactions at 99.50 to see if the momentum continues from there.
Levels of interest in the dollar index:
Resistance levels
- Resistance is 99.40 to 99.50 — the highs of the range
- 99.68 – Initial rise in war
- 100.00 to 100.50 — major resistance area
- 100.544 — highest levels during the war
Support levels
- 99.00 Intraday pivot point — range lows
- 98.50 to 98.70 — Axis of War, support now
- 97.40 to 97.60 — triple bottom support
- From 96.40 to 96.80 — the lowest levels of support for 2025
- The lows of the range are on consolidation in early 2022, just below 96.00
GBP/USD 4-hour chart and technical levels
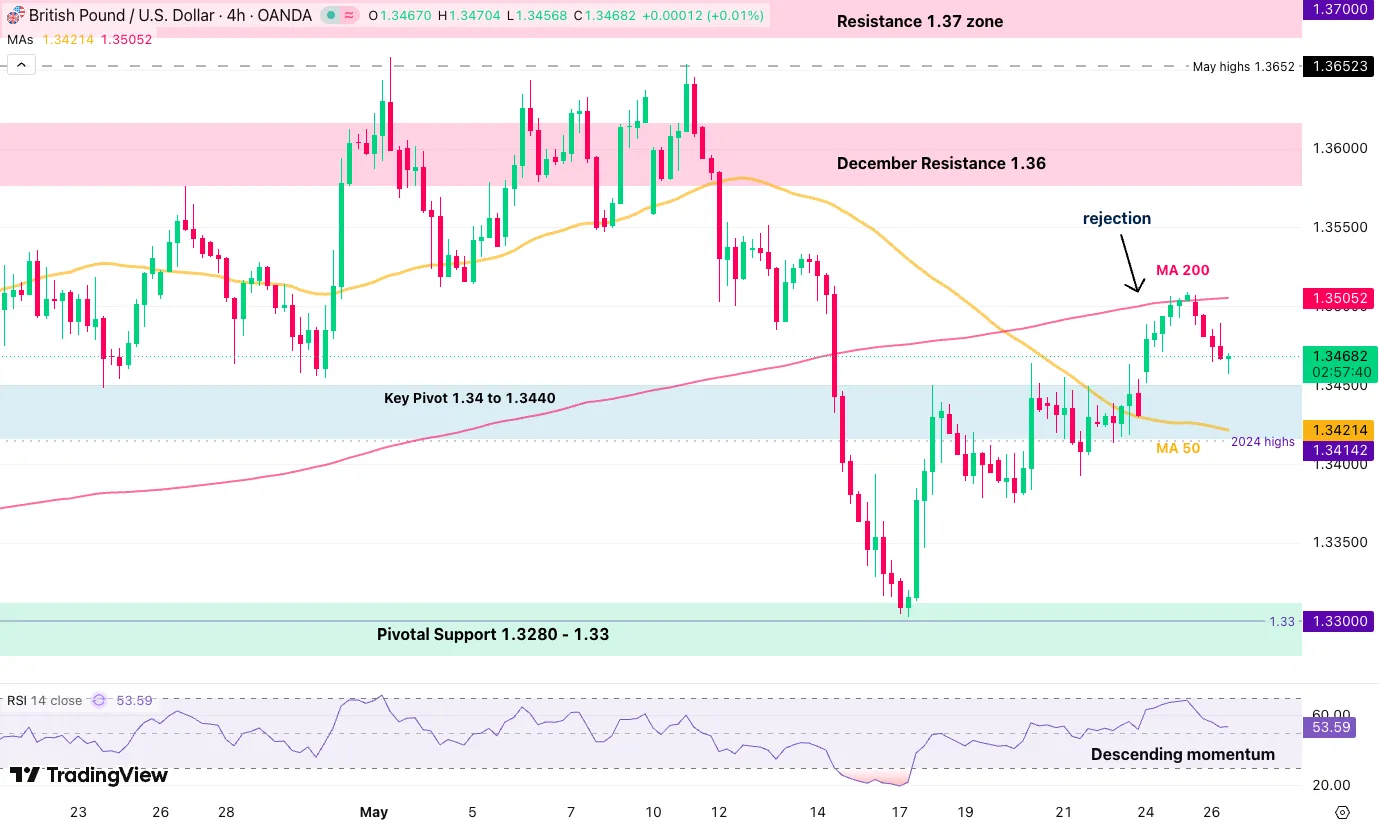
GBP/USD four-hour chart, May 28, 2026 – Source: TradingView.
GBP/USD continued to rise above the pivot zone but stopped at the 200-day 4-hour moving average near 1.3500.
With the price currently pulling back towards the pivot zone, the move is more mixed than completely bearish. Traders can wait for either a double top around the moving average or a breakout below 1.3420, the 50 moving average, to confirm a downward move.
Any close above the 200-MA will add more bullish momentum.
Interest levels for GBP/USD:
Resistance levels
- The 4-hour moving average for 200 days is around 1.3500
- 1.3600 — December resistance and range top
- 1.36010 — pre-FOMC highs
- 1.3700 — resistance area
- 2025 resistance is around 1.3800
Support levels
- 1.3400 to 1.3440 — the main pivot
- From 1.3280 to 1.3300 — pivotal support
- 1.3200 — War support
EUR/USD 4-hour chart and technical levels
EUR/USD four-hour chart, May 26, 2026 – Source: TradingView.
EUR/USD is rejecting the 4-hour and 50-period moving average, with RSI momentum also turning to the downside, suggesting more downside ahead.
After failing to break the intermediate level of the long-term descending channel, the lower limit at 1.1580 could be retested soon.
Any break and close above 1.1660 will invalidate the bearish pattern.
Levels to place on your EUR/USD charts:
Resistance levels
- 1.1635 to 1.1655 — Pivot
- From 1.1700 to 1.1720 — March resistance
- Resistance area is around 1.1800 plus or minus 150 points
- 1.1830 – June 2025 highs
Support levels
- 1.1580 — channel minimum
- 1.1540 to 1.1580 — war support
- From 1.1475 to 1.1500 — November support
- 1.1410 — War lows
Safe deals!