

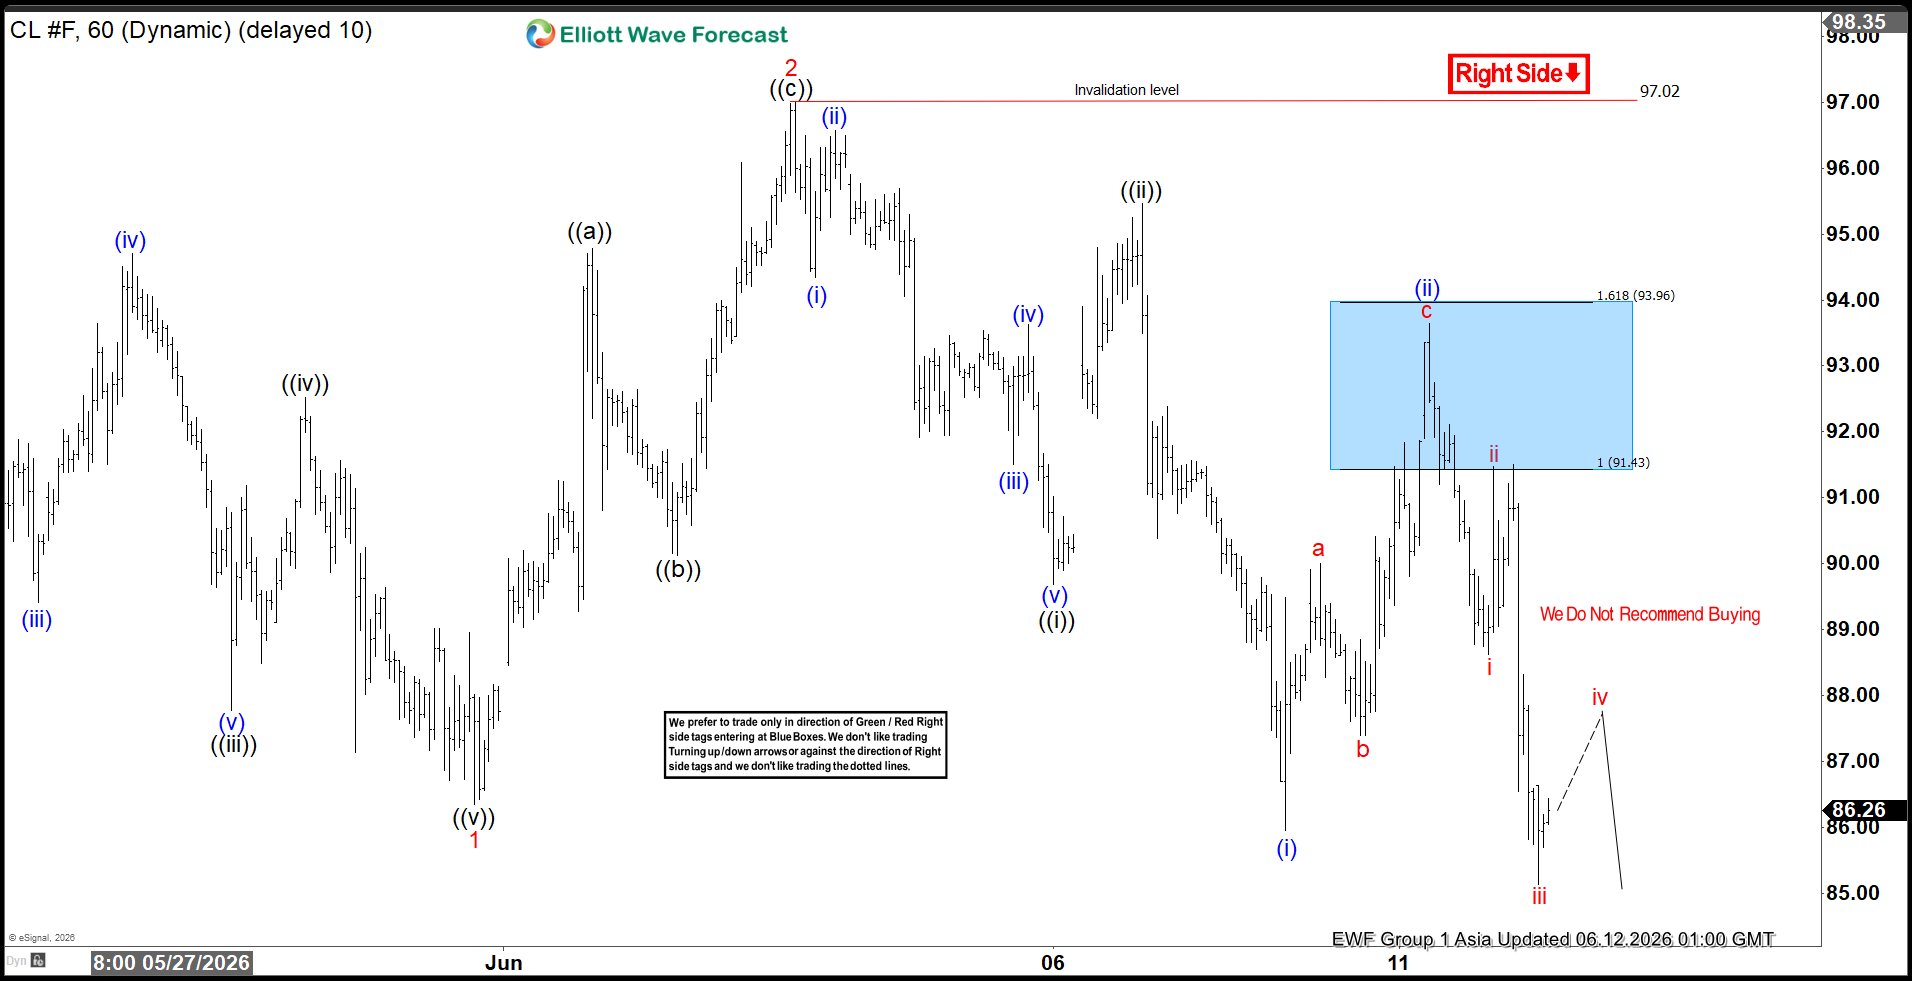
WTI Light (CL) crude oil is maintaining a downward sequence that started at the high on May 19, 2026. The decline from that peak produced wave 1 at $86.35, followed by a corrective rise in wave 2. This correction appeared as a zigzag, with wave ((a)) ending at $94.78, wave ((b)) pulled back to $90.12, and wave ((c)) extended higher to US$97.02. This movement completed wave 2 at a higher degree. After that, oil resumed its decline and broke below the termination of wave 1, confirming the bearish structure.
The downtrend is guided by the 100% – 123.6% Fibonacci extension from the May 19 high. This extension corresponds to the $68-73 area, which now represents a potential support area. From the top of wave 2, wave ((i)) ended at $89.68, while wave ((ii)) rose to $95.47. The oil then extended down again, forming an overlapping sequence. Within this structure, wave (i) of ((iii)) ended at $85.95, and wave (ii) of ((iii)) rose to $93.64. The market has since resumed its decline, keeping the bearish outlook intact.
In the near term, as long as the price remains below $97.02, the rallies are expected to fail in three or seven swings. This enhances the possibility of continued downward pressure. The technical outlook highlights the possibility of oil extending lower towards the $68-73 region, consistent with the broader bearish sequence.
Light Crude Oil (CL_F) 60-Minute Elliott Wave Chart
 CL_F Elliott Wave Video:
You are currently viewing placeholder content from shortening. To access the actual content, click the button below. Please note that doing so will result in data being shared with external service providers.


