

After Bitcoin’s decisive collapse from a months-long upward channel, the largest cryptocurrency remains under tremendous pressure. While buyers were able to defend the $60,000 support area and stimulate a short-term recovery, the broader structure still favors sellers unless BTC can reclaim several important resistance levels.
Bitcoin price analysis: daily chart
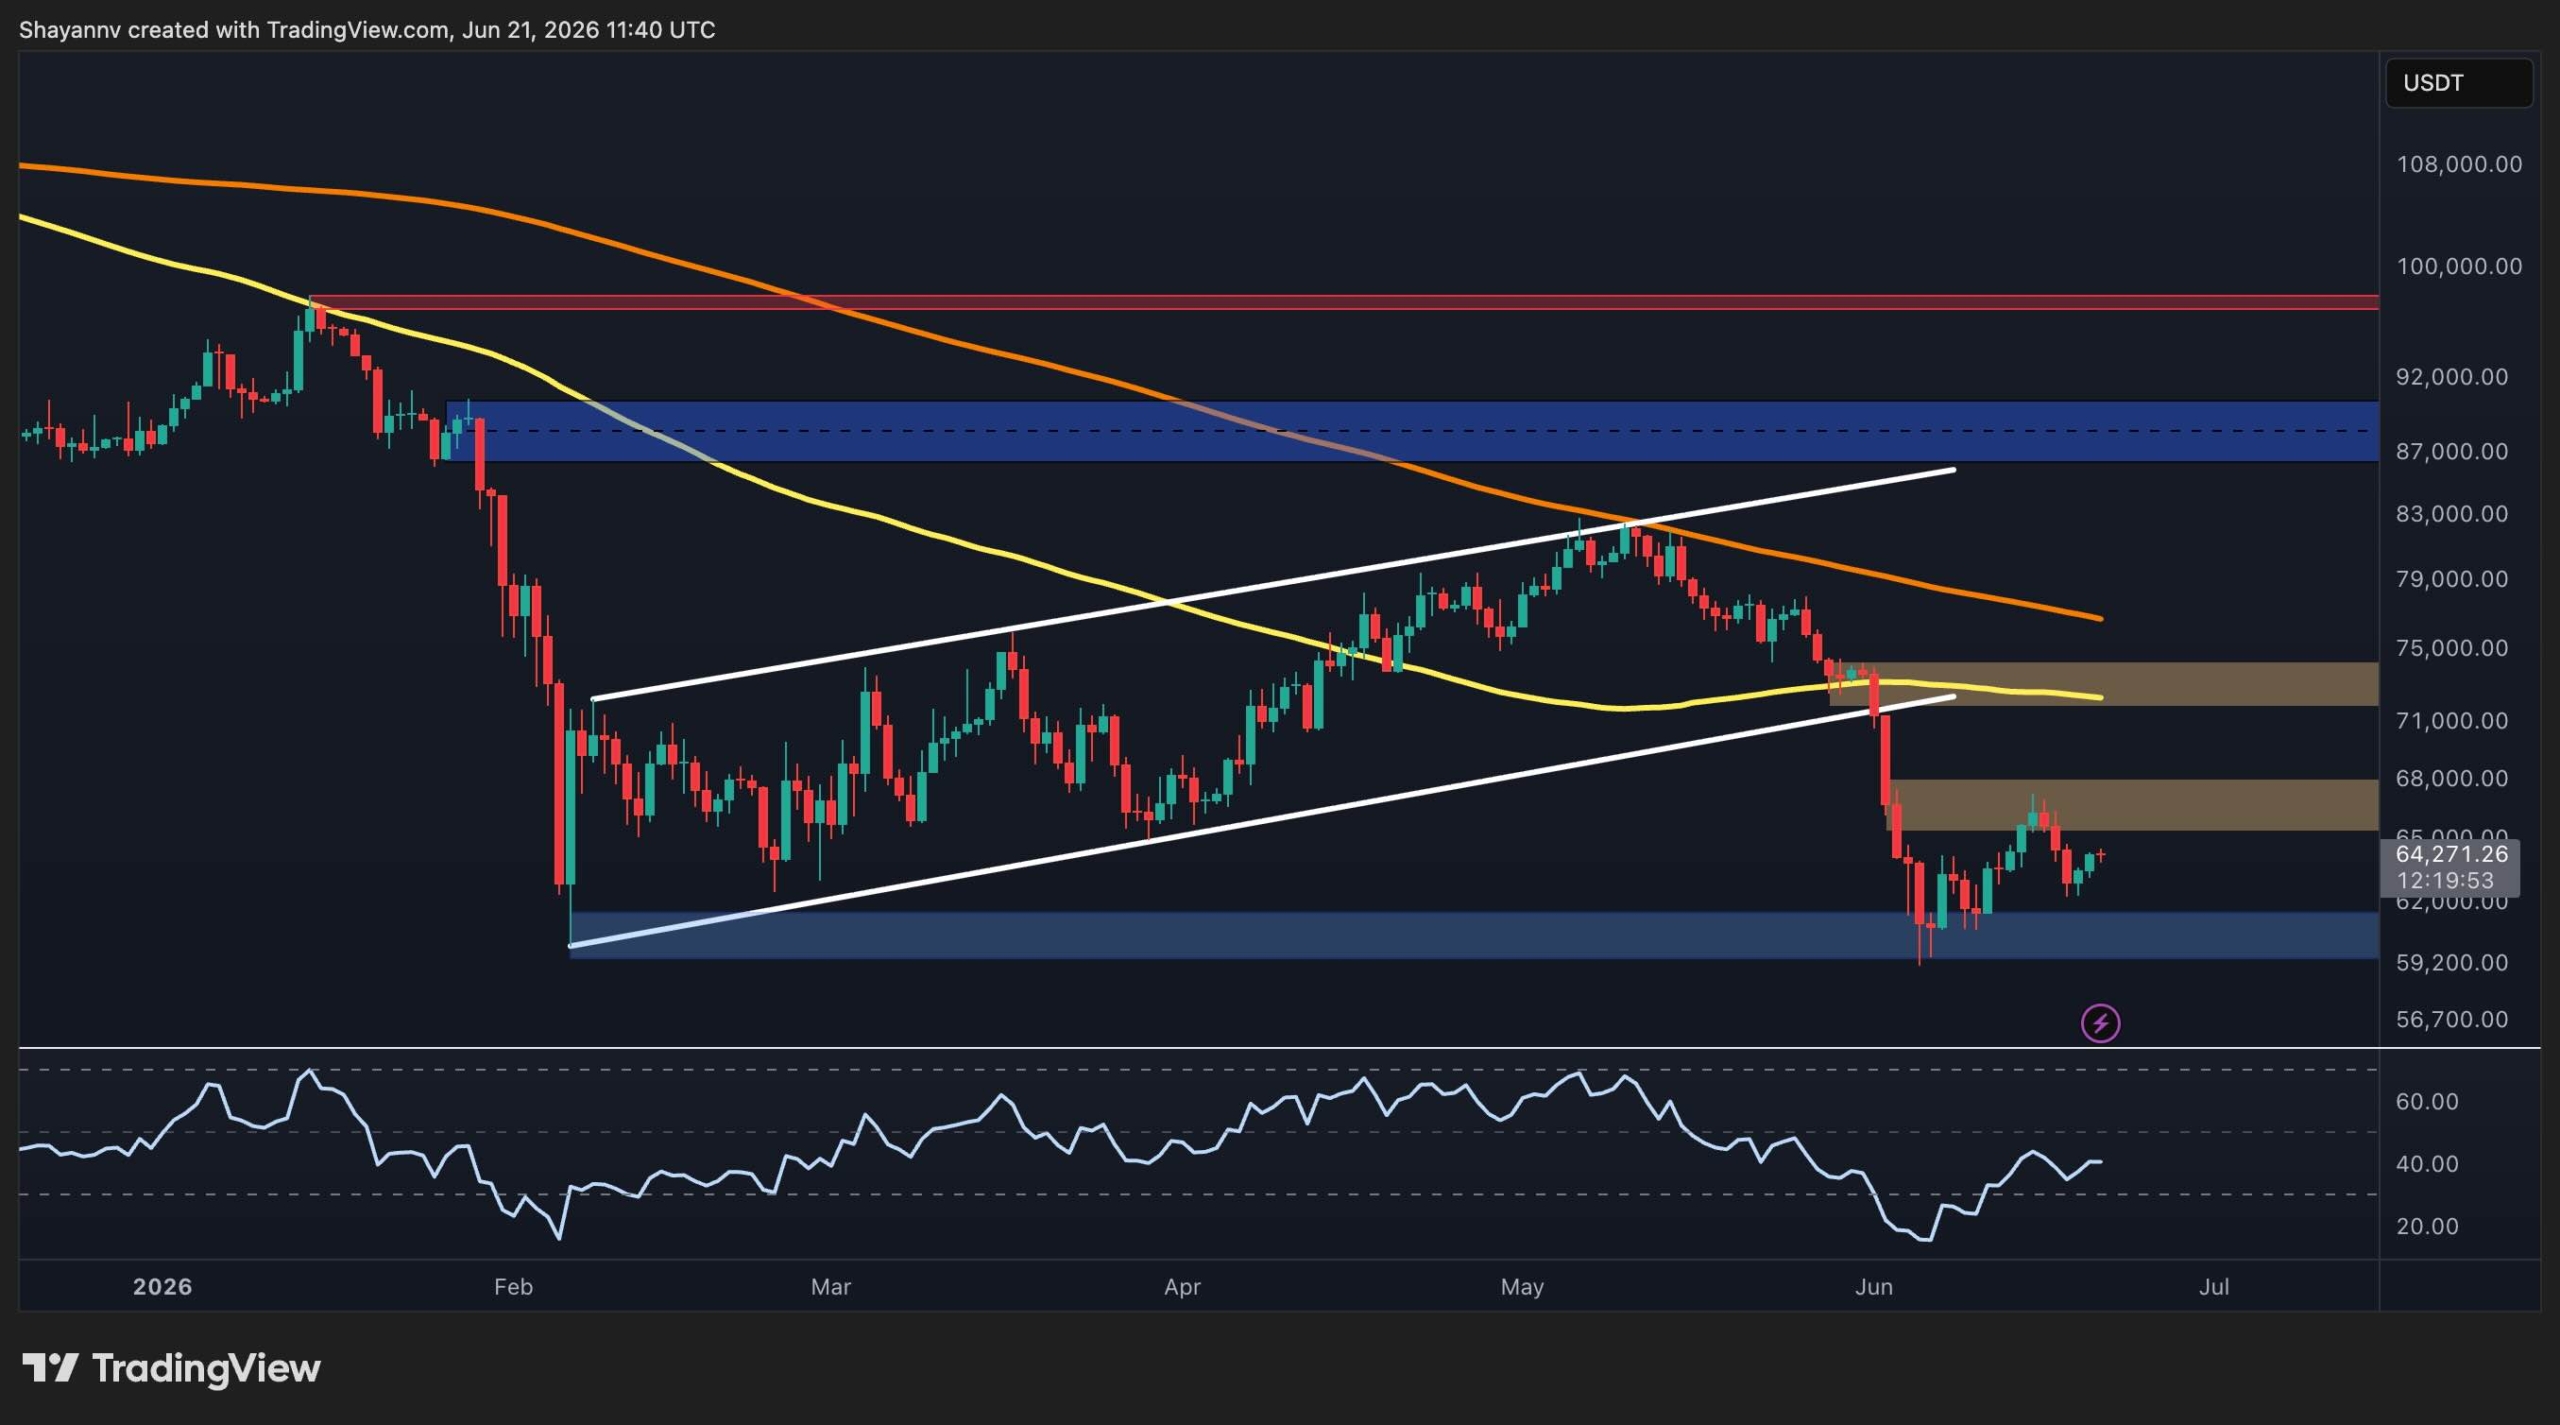
On the daily time frame, BTC recently confirmed a bearish breakdown under a large ascending channel, accelerating the selling pressure and pushing the asset towards the key support area around $60,000, where buyers stepped in and halted the downtrend.
The sell-off also pushed Bitcoin below its 100-day and 200-day moving averages. These moving averages are currently positioned around $72,000 and $76,000, respectively. The loss of the 100-day moving average, which was supposed to act as a dynamic support level, indicates a significant deterioration in the broader market structure and indicates that sellers continue to control the trend.
After a sharp decline, BTC found demand near $60,000 and made a modest recovery towards the $64,000 region. However, the recovery is still relatively weak compared to the size of the previous decline.
The first major resistance now lies between $65,000 and $68,000, where the previous support area has turned into supply. Above that, the most important resistance area is located around $72,000 to $75,000, which coincides with the 100-day moving average and the lower part of the broken ascending channel. Successful restoration of this area would be the first indication that the recent collapse may have been a bear trap.
On the downside, the $60,000 area remains the most important support level. Losing this area could expose Bitcoin to a deeper correction towards lower liquidity pools and possibly trigger another wave of capitulation.
BTC/USDT 4-hour chart
The 4-hour time frame provides a clearer view of the recent breakdown and subsequent consolidation phase. After losing the $72,000 support zone to $74,000, BTC saw a strong sell-off towards the $60,000 demand zone. Since then, the price has formed a short-term upward channel, indicating a corrective recovery rather than a confirmed trend reversal.
However, the recent rejection of the upper boundary of this channel and subsequent breakdown indicate that upward momentum remains limited. Although BTC managed to stabilize and reclaim the mid-$64k region, it continues to trade below the major resistance block between $65k and $68k.
As long as the price remains below this supply zone, the current recovery looks corrective in nature. A successful break above $68,000 could open the door for a move towards the larger resistance range at $72,000 to $74,000. Conversely, another rejection of current levels would increase the likelihood of a retest of the $60,000 support area.
The Relative Strength Index on the 4-hour chart has rebounded to the neutral zone, reflecting improving short-term momentum. However, it has not yet entered into strong bullish conditions, supporting the view that the ongoing move remains a comfortable rally within a broader bearish structure.

Sentiment analysis
The funding rate chart provides important insight into your current derivatives positions. Funding rates have remained mostly negative during most of the recent decline, suggesting that short positions dominated the market during the sell-off. This continued negative funding reflects bearish sentiment and strong short exposure as BTC trading declines.
Recently, funding rates have returned to positive territory, currently hovering around 0.004. This shift indicates that market participants are gradually rebuilding long exposure after the bounce from the $60,000 support area.
From a contrarian perspective, the return of finances to normal after a long period of negative readings can be seen as a constructive development. The market has already seen a major deleveraging event, and the recovery in funding indicates improved confidence among futures traders.
However, current funding levels are still well below the frenzied conditions seen during previous bull phases. This suggests that although sentiment is improving, leverage remains relatively limited and does not yet confirm the start of a sustainable uptrend.
Overall, derivatives data suggests that downward pressure has eased following the recent liquidation event, but Bitcoin still needs to reclaim the $68K and $72K-$74K resistance areas before a broader bullish recovery is confirmed. Until then, a bounce from $60,000 looks more consistent with a comfortable rally within a weak market structure.

Free Binance $600 (CryptoPotato Exclusive): Use this link To register a new account and get an exclusive welcome offer of $600 on Binance (Full details).
Limited offer for Bybit’s CryptoPotato readers: Use this link To register and open a free position worth $500 on any currency!
Disclaimer: The information contained in CryptoPotato is that of the cited authors. They do not represent CryptoPotato’s opinions on buying, selling or holding any investments. We advise you to conduct your own research before making any investment decisions. Use of the information provided is at your own risk. See our disclaimer for more information.


