

The US dollar saw a sharp correction after the fragile ceasefire began, but this downtrend has now stopped completely.
As the peace rhetoric falters, it is clear that the foreign exchange market is taking a more realistic view of the US-Iran diplomatic talks than stock markets, which remain optimistic despite little real progress.
Foreign exchange markets focus on energy prices rather than excitement in the technology sector, and adjust to geopolitical risks.
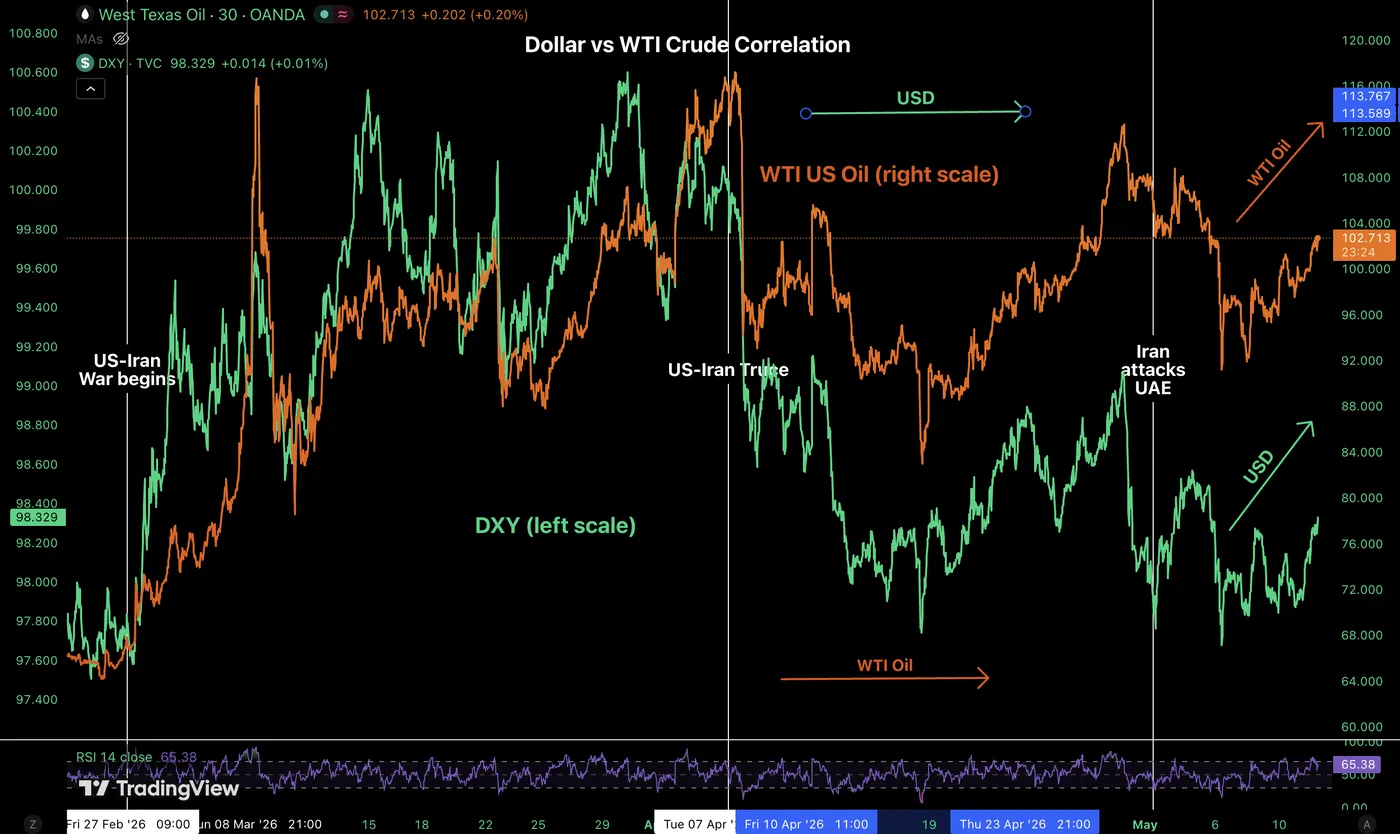
Petrodollar Trade: Oil’s correlation with the US dollar. Source: TradingView, May 12, 2026.
After rising against the US dollar in late March and early April, Most major currencies are back to trading in a narrow range.
Today, though, they are quickly reversing with WTI back above $100 with the recent tense narrative.
Ongoing conflict and related economic challenges support the US dollar. Although new reports indicate that Iran may dilute HEU to 3.7% and 20%, diplomatic talks have generally stalled, and uncertainty continues to disrupt energy supply chains as demand for the US dollar increases.
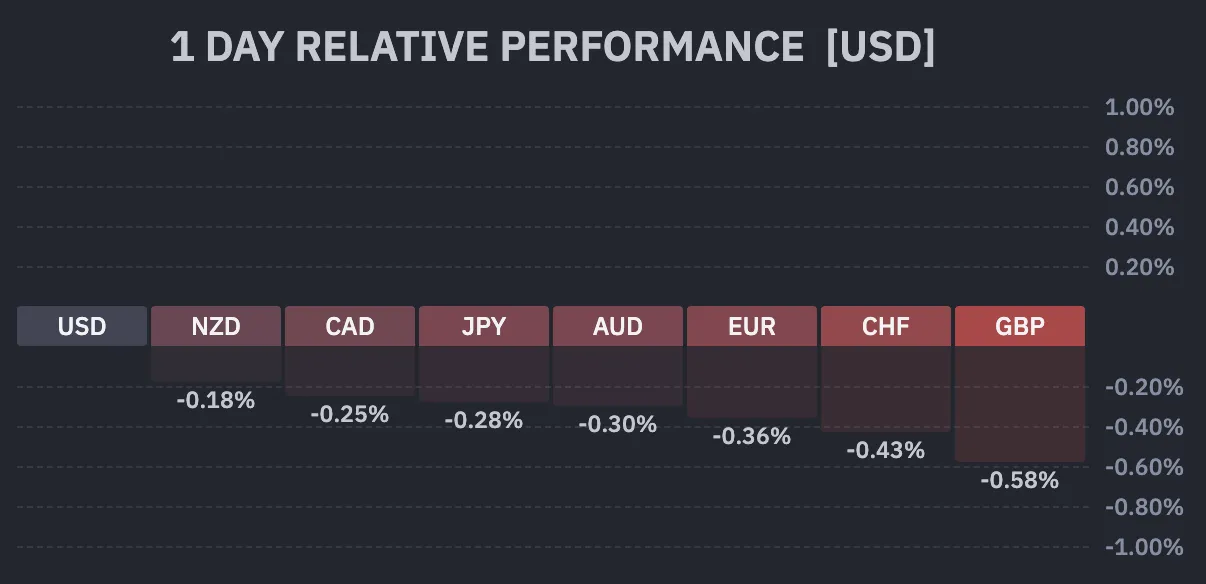
Forex performance for the current session. Source: Finviz, May 12, 2026.
Coupled with ongoing geopolitical uncertainty, a higher-than-expected inflation report has strengthened the US dollar, with another inflation report due tomorrow in the form of the Producer Price Index.
Today’s CPI showed core inflation at 3.8%, compared to 3.7% expected, and core CPI at 2.8%, compared to 2.6% expected. That was a significant rise, although not very surprising given the explosion in gas prices.
The strong inflation reading continues to indicate that the Fed will keep interest rates unchanged, if not raise them, putting pressure on other major currencies.
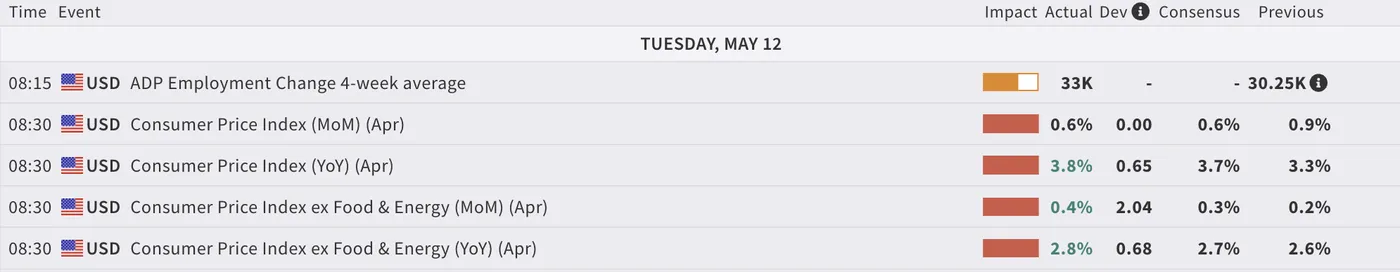
American morning data. Source: MarketPulse Economic Calendar.
We will look at the Dollar Index, EUR/USD, and GBP/USD to assess the current state of the forex market and where to look next.
4-hour dollar index chart
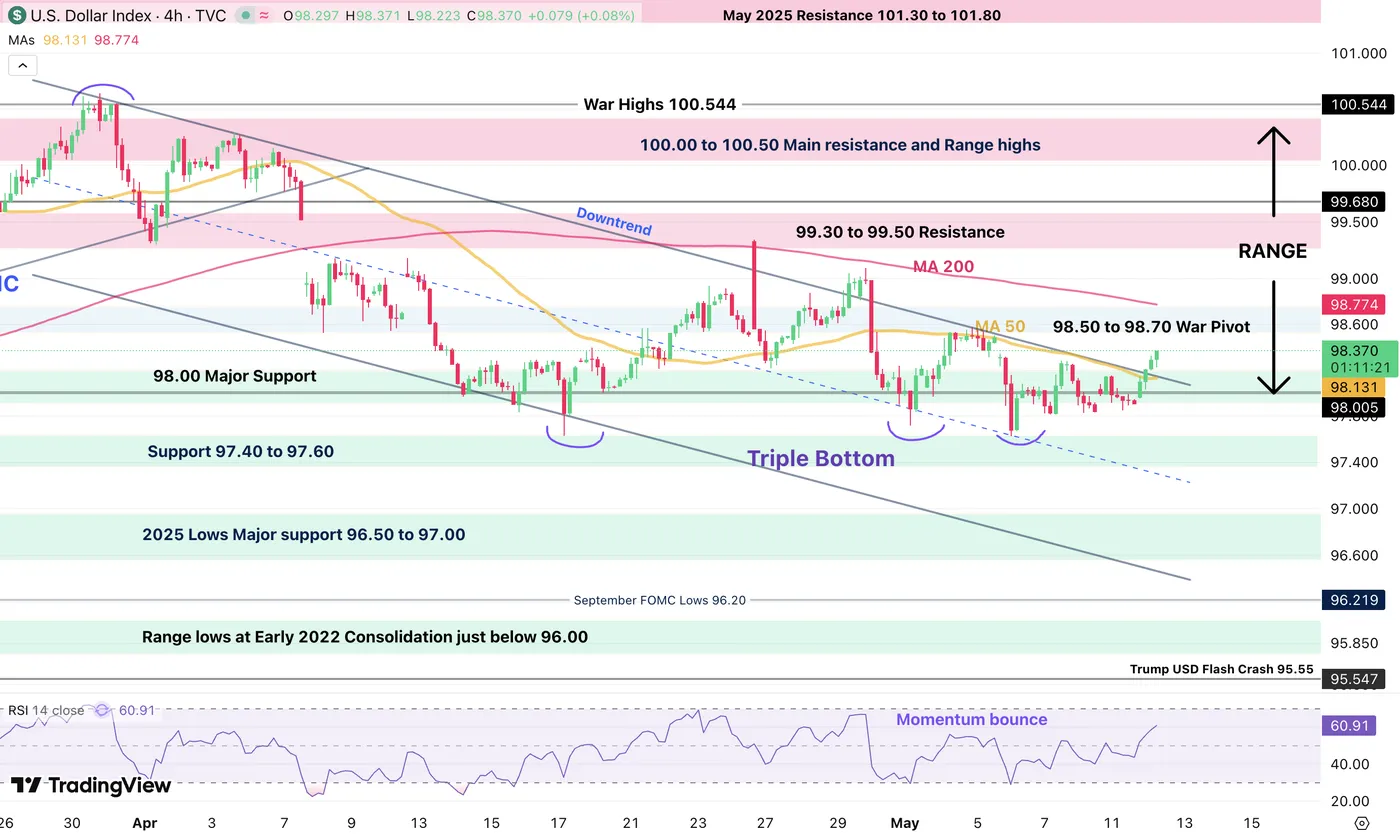
Daily chart of the dollar index, May 12, 2026. Source: TradingView.
The US dollar is exiting the downtrend channel recorded at the end of March after forming a triple bottom around 97.50.
With the recent lows coinciding with the middle area of the larger range from 96.00 to 100.00, It is possible that the consolidation between 98.00 and 100.00 will increase as long as the peace process does not move forward.
We expect further rises in the US dollar if the index breaks the 98.50 level.
Levels of interest in the dollar index:
Resistance levels
- 98.50 to 98.70 Axis of War
- 98.78 4 hours 200 period MA
- Resistance 99.40 to 99.50
- Initial war high 99.68
- The main resistance area is from 100.00 to 100.50
- Its highest level in the war was 100,544
Support levels
- 98.00 2025 support, test and drop below
- Support from 97.40 to 97.60, triple bottom
- 2025 lows from 96.40 to 96.80 support
- The early 2022 range lows are solidified just below 96.00
GBP/USD 4-hour chart and technical levels
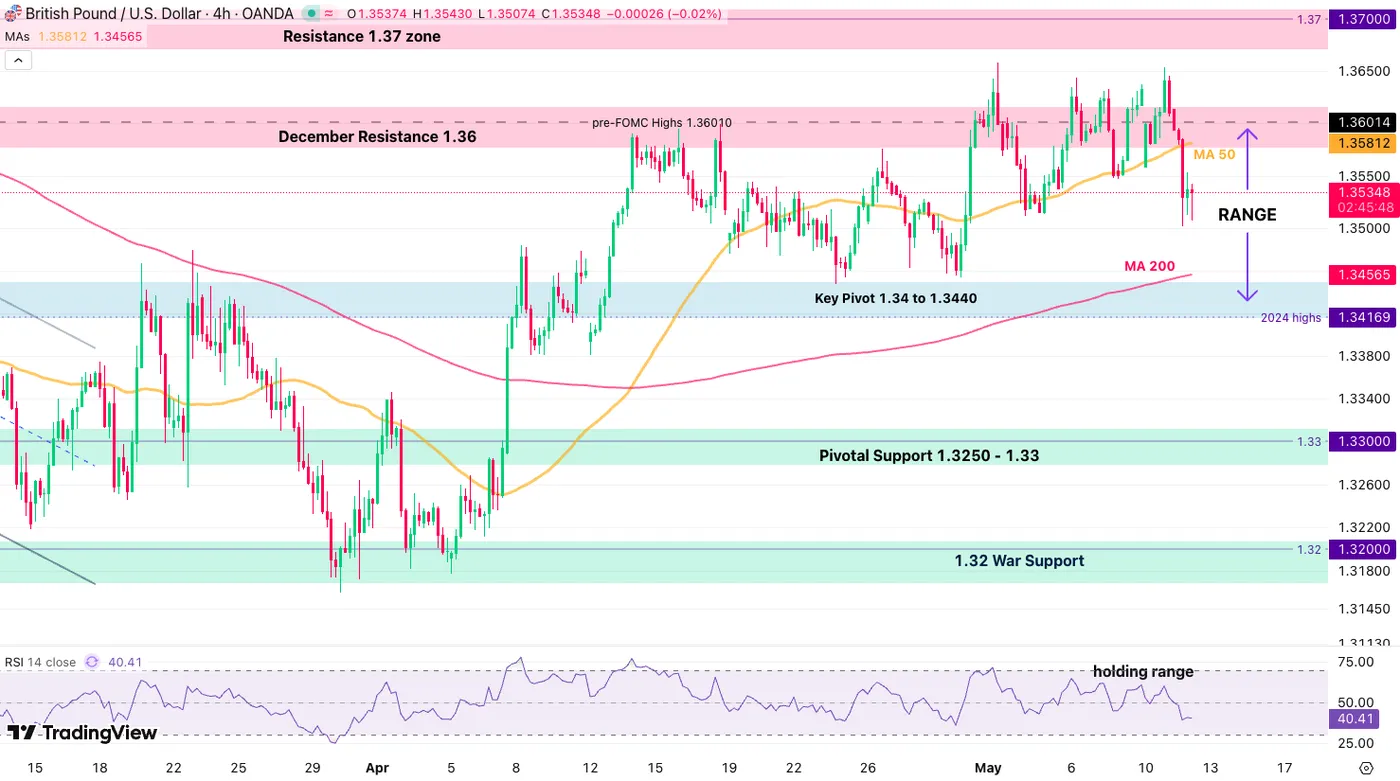
GBP/USD four-hour chart, May 12, 2026. Source: TradingView.
The GBP/USD pair is still trading between 1.3410 and 1.36 but is now rejecting the resistance area and heading back to support.
Add to this ongoing external flows and political turmoil in the UK, with Keir Starmer’s ministers resigning, and the outlook for the pound looks bearish.
While it is still far away, keep an eye on whether 1.34170, the 2024 high, holds.
Interest levels for GBP/USD:
Resistance levels
- December resistance 1.36, range highs
- Pre-FOMC highs 1.36010
- Resistance area 1.37
- 2025 resistance is around 1.38
Support levels
- The main pivot is from 1.3410 to 1.3440
- 1.34170, 2024 top level
- Pivotal support from 1.3250 to 1.33
- 1.32 Support for war
EUR/USD 4-hour chart and technical levels
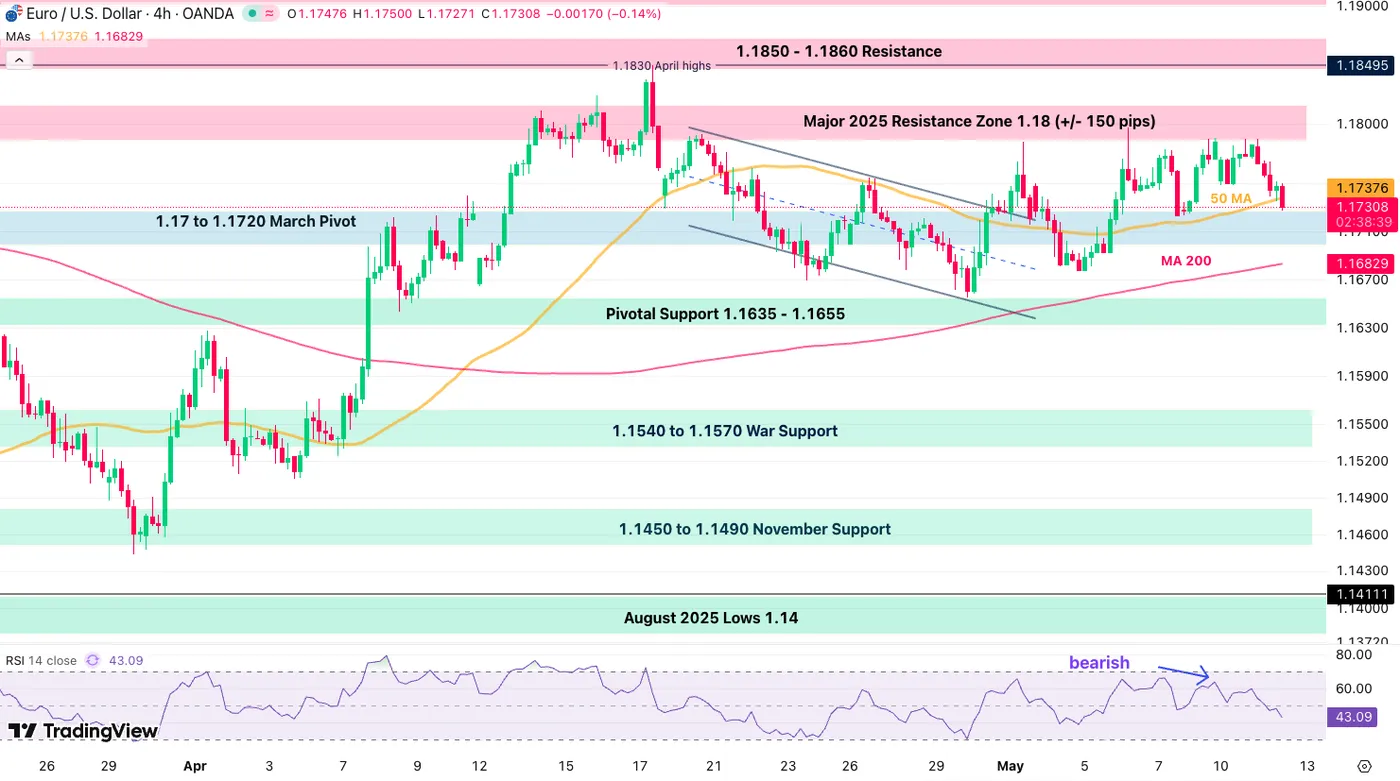
EUR/USD four-hour chart, May 12, 2026. Source: TradingView.
EUR/USD is also rejecting the 1.18 resistance level and is rapidly falling towards the 1.17 momentum pivot, with a downward acceleration expected as the RSI drops below neutrality.
Sellers are also breaching the 4-hour and 50-period moving average, which could impact price action. While momentum is still missing, traders will want to confirm the move with strong bearish candles and trading volume around 1.1720.
Levels to place on your EUR/USD charts:
Resistance levels
- 1.17380 4H 50 period MA
- Resistance area is around 1.18, +/- 150 pips
- 1.1830 June 2025 highs
- 1.1850 to 1.1860 recent test
- September 2021 highs, resistance zone 1.19 to 1.1950
Support levels
- 1.17 to 1.1720 March pivot
- High bounce at 1.17200, bearish below
- Major Pivot 1.16250 to 1.16350
- War support from 1.1540 to 1.1570
- Support from 1.1475 to 1.15 November
- War lows 1.1410
Safe trades and closely monitor ceasefire news.


