

The USD/JPY pair often plays tricks on forex traders, and this time it completely avoids volatility after massive upward and downward moves.
The currency pair is known for its erratic price movements, which are strongly influenced by price movements, global trade and inflation, as well as regional and geopolitical developments, all of which have been strongly affected since the beginning of the US-Iran conflict.
Having been a major safe haven currency since the early 2000s, benefiting from lower yields in times of panic, the yen has been unable to find any traction during this struggle.
Even with the initial sell-off in equity markets, risk-averse assets and currencies failed to gain traction, with the US dollar and WTI attracting all the attention.
With the belief that the conflict would remain focused on the Middle East, a broader flight to safety was avoided.
But the economic damage to Europe and, in the outlook for USD/JPY, Japan and Asia, remains heavy, and this has led to massive gains in the US dollar against the currencies of these regions.
You can see the strong correlation between USD/JPY movements and oil movements in our latest analysis of the pair.
Add to this narrative the stunning stall in inflation in Japan, which was the only way to justify a return to a less accommodative policy, and traders really found a natural racing ground to return to Japanese short positions.
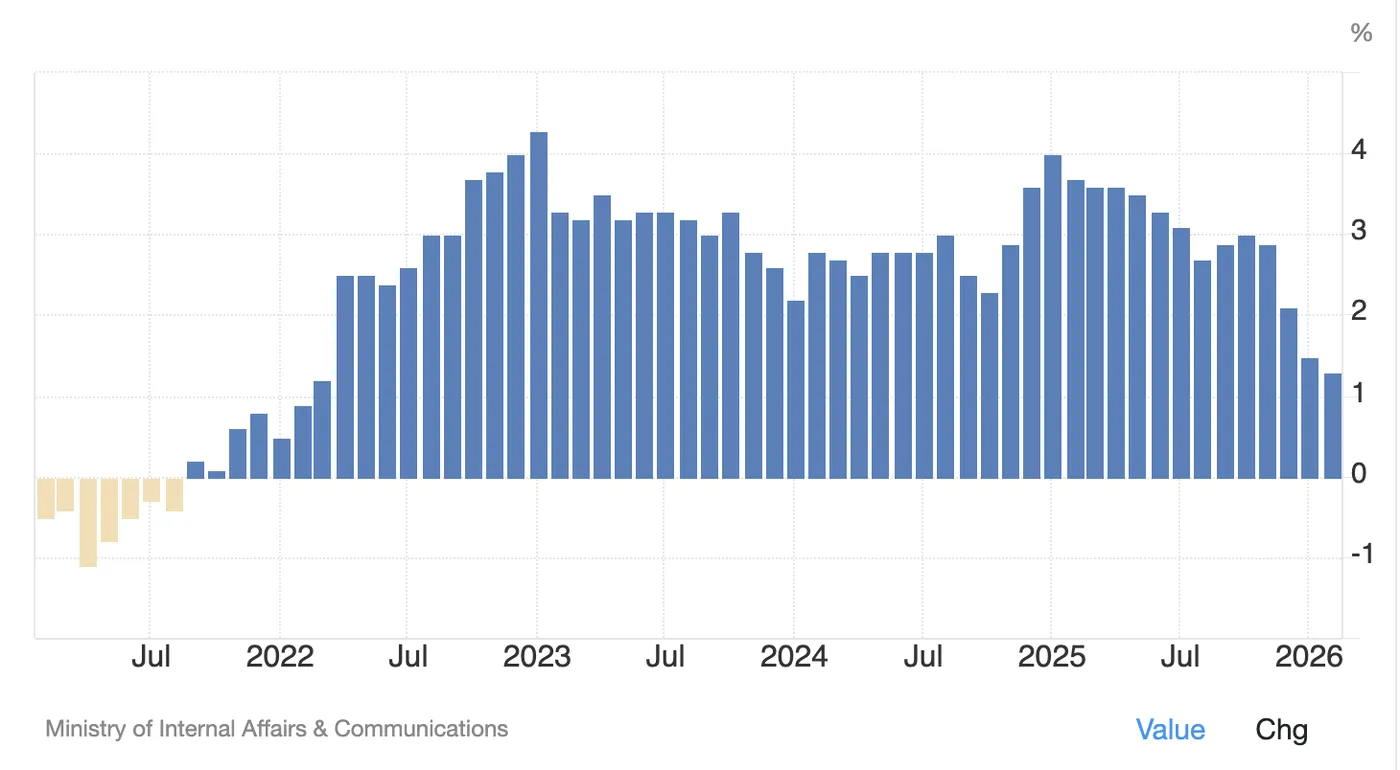
Latest Japanese CPI data – Courtesy of Trading Economics
The Japanese CPI, which will be released tonight at 19:30 (ET), is expected to rebound, as supply-side inflationary pressures may once again push Japanese consumer prices slowly higher.
The Bank of Japan has mentioned conflict-induced inflation several times but is said to still be leaning towards a pause at the next meeting, while hinting at a greater chance of a 25 basis point rate hike in June to allow further analysis of the war’s impact.
So, unless the CPI beats expectations by a lot, this pricing won’t change much.
With the second round of talks postponed for about a week and a half, set to resume tomorrow and continue throughout the weekend, this will be a defining moment for the FX pair.
With a clear 2,000 point indecision range forming in the recent move, traders are waiting to see if a suitable peaceful solution has been reached (which means a lower breakout in the range) or if the war will resume, which will add more opportunities to revisit the 2026 highs (above 160.00).
Let’s dive into the analysis of the intraday time frame for Gopher – more commonly called, USD/JPY.
Multi-time frame analysis of the USD/JPY pair
Four hour chart
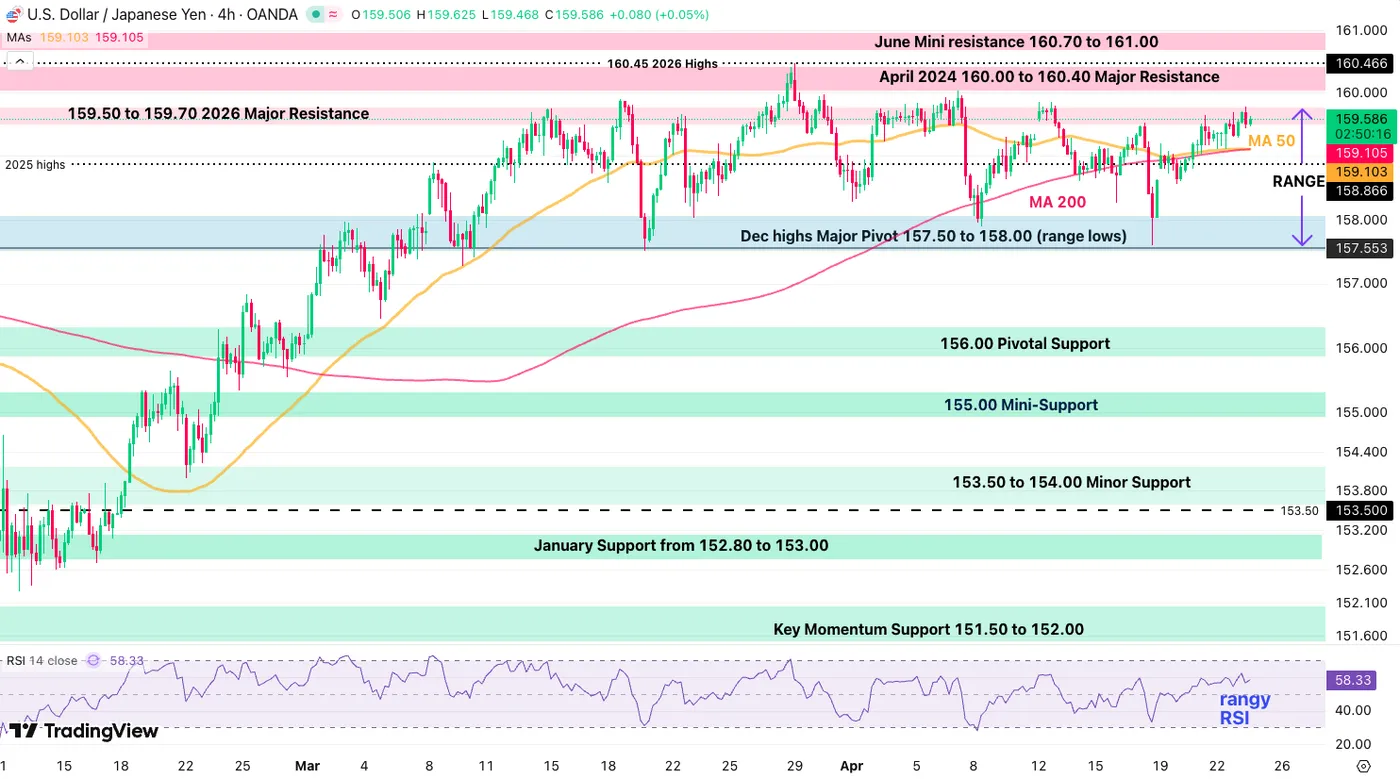
4-hour chart of USD/JPY. April 23, 2026 – Source: TradingView
Instead of entering a corrective phase, as expected by the break below the major moving averages and the ascending channel, the USD/JPY pair maintained a clearly range-bound picture as the US dollar completely stopped correcting.
Since hitting new 2026 highs on March 27, the pair has been stuck in a clear 2,000 pip range between 157.50 and 159.50 (+/- 100 pips).
While consolidation is strong, as seen with the 50 and 200 moving averages holding steady, traders will have to remain cautious as the narrative may change over the weekend.
Currently at the resistance level, USD/JPY has more chances for a downside rejection, but any headlines regarding a compromised peace process would push for a breakout towards 160.50.
Let’s take a closer look.
One hour chart and technical levels
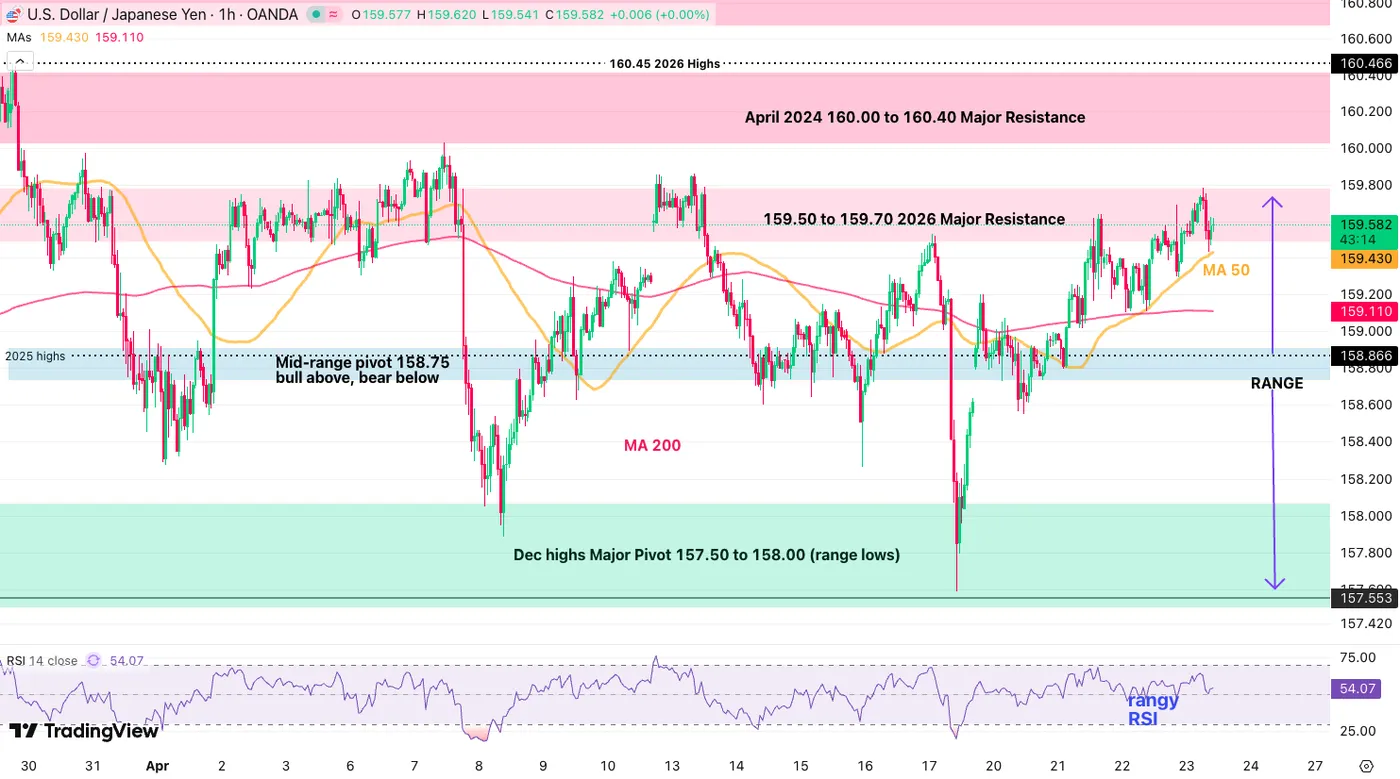
One-hour chart of USD/JPY. April 23, 2026 – Source: TradingView
As we can see on the 1-hour time frame, the range saw a rapid upward and downward movement, falling to support last Friday and breaking out again to retest resistance.
With the North American trading day not expected to bring any tangible change, traders will need to be patient.
If CPI data comes in hotter, expect to see a decline below 159.43 (50-hour MA) which could provide good sell stops – an expansion below 158.80 would see a downward acceleration.
- Watch out if the action breaks 159.80
- The weekend will provide high volatility action on Monday, so keep an eye on your volume ahead of major developments.
Resistance levels
- 159.50 to 159.70 2026 key resistance (range highs)
- 159.78 daily highs
- April 2024 160.00 to 160.40 key resistance
- Minor resistance for June from 160.70 to 161.00
Support levels
- 159.43 (50 hours MA)
- Medium term pivot 158.75 up, down below
- December highs, major pivot at 157.50 to 158.00 (range lows)
- 156.00 Pivotal support
- 155.00 small support
Safe deals!


