
Bitcoin is trading at around $76,000 as April comes to a close. He is sitting at one of the most technically loaded turns of his entire corrective phase. After recovering from the February low near $60K, BTC has been quietly rebuilding momentum into the mid-$70K, and with whale-sized spot accumulation now at current levels, the market is asking a pointed question: Is the correction that defined the first quarter of 2026 finally over?
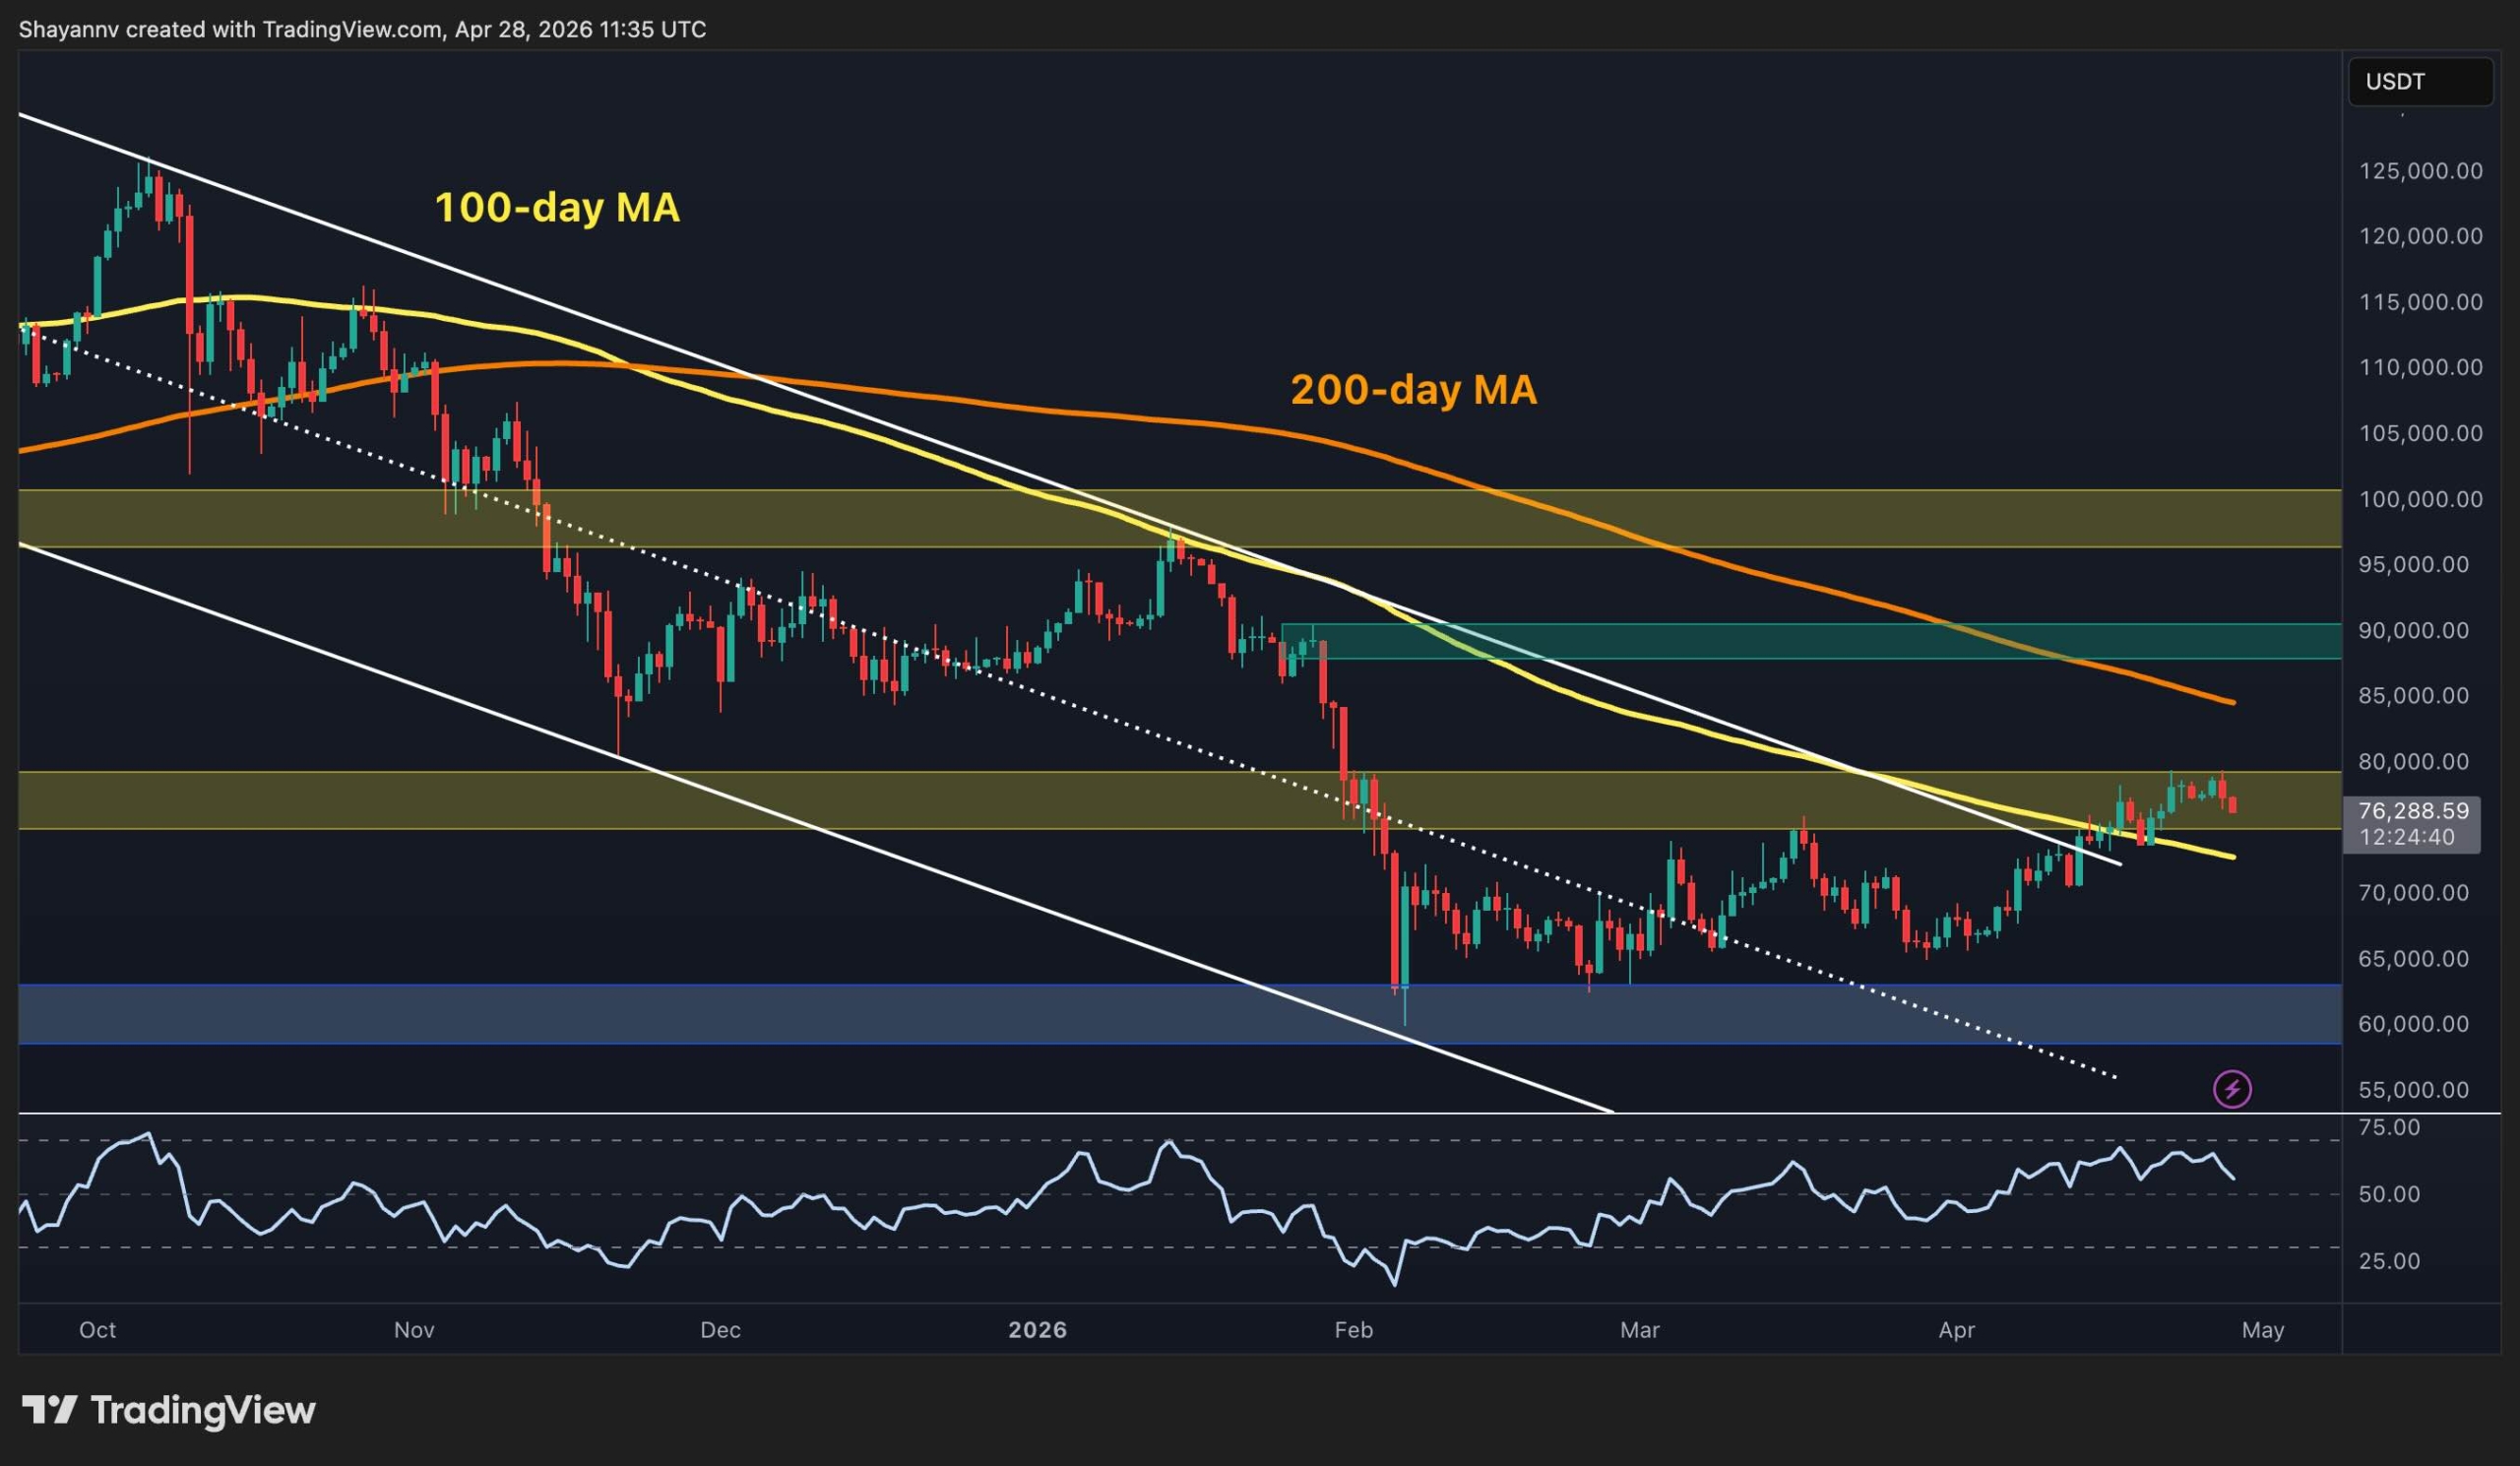
Bitcoin price analysis: daily chart
On the daily time frame, Bitcoin has broken through the upper border of a bearish channel that has been in place since the peak of the cycle above $120,000 in late 2025. The lower 100-day moving average, located around $72,000-$73,000, has also been broken, resulting in a confluence of two major support elements below the current price. The RSI is also hovering above the 50 level but has not yet shown an overbought signal, indicating that the upward momentum is gradually increasing.
A clean daily close above the key resistance level of $80,000 is the structural requirement for the market to change this bias. The 200-day moving average falling around $85,000 represents the next major upper barrier if a breakout occurs. However, a rejection from the $80,000 level and a daily close below $72,000 would put the bullish structure at risk and refocus attention on the $60,000-$62,000 demand zone.

BTC/USDT 4-hour chart
On the 4-hour chart, the larger upward channel formed from the February low near $60,000 remains structurally sound. However, the sharp rally that pushed the asset to near $80,000 has clearly stopped after testing and rejection from the upper border of the channel. The RSI in this time frame has also fallen below 50 and indicates a potential shift in momentum in the short term.
The blue trend line representing the steeper inside rally structure has now been broken to the downside, which could lead to a deeper correction towards the $74,000 level and even the $70,000 level if demand fails to turn the trend around. On the other hand, a clean bounce and recovery of $80,000 could invalidate all bearish scenarios and start a strong recovery phase for Bitcoin on all time frames.

Sentiment analysis
CryptoQuant’s spot average order volume data presents one of the most compelling on-chain developments this cycle. Large whale orders in the $60,000 to $80,000 range are congregating with a density not seen since the reaccumulation phase in 2024 around the same price levels. These are large spot market participants absorbing supply at current prices, not leveraged traders chasing momentum, which historically carries more structural weight.
What makes the reference particularly notable is the context. Whales are not accumulating into a breakout, but into a resistance, which is exactly the behavior seen at previous cycle inflection points.
Retail participation is also present, but is secondary to the institutional level order flow that dominates the chart. If this build-up continues and the technical resistance level at $80,000 eventually falls, the on-chain picture will provide an early signal that most price analysis would have merely missed.

Prefer CryptoPotato on Google News – Never miss a single breaking step
Free Binance $600 (CryptoPotato Exclusive): Use this link To register a new account and get an exclusive welcome offer of $600 on Binance (Full details).
Limited offer for Bybit’s CryptoPotato readers: Use this link To register and open a free position worth $500 on any currency!
Disclaimer: The information contained in CryptoPotato is that of the cited authors. They do not represent CryptoPotato’s opinions on buying, selling or holding any investments. We advise you to conduct your own research before making any investment decisions. Use of the information provided is at your own risk. See our disclaimer for more information.


