

Key points
- WTI failed to cross the $105 level and pared most of the gains.
- A major bearish trend line with resistance is forming at $96.40 on the 4-hours chart of XTI/USD.
- Gold faces a major hurdle near the $4,950 level.
- The EUR/USD pair appears to be consolidating its gains above the 1.1740 support level.
Technical analysis of WTI crude oil price
WTI prices faced resistance near the $105 level against the US dollar. The price started a new low below $100 and $95.
Looking at the 4-hours chart of XTI/USD, the price has stabilized below $95, the 100 SMA (red, 4-hours), and the 200 SMA (green, 4-hours). However, the bulls are active near the key support level at $88.
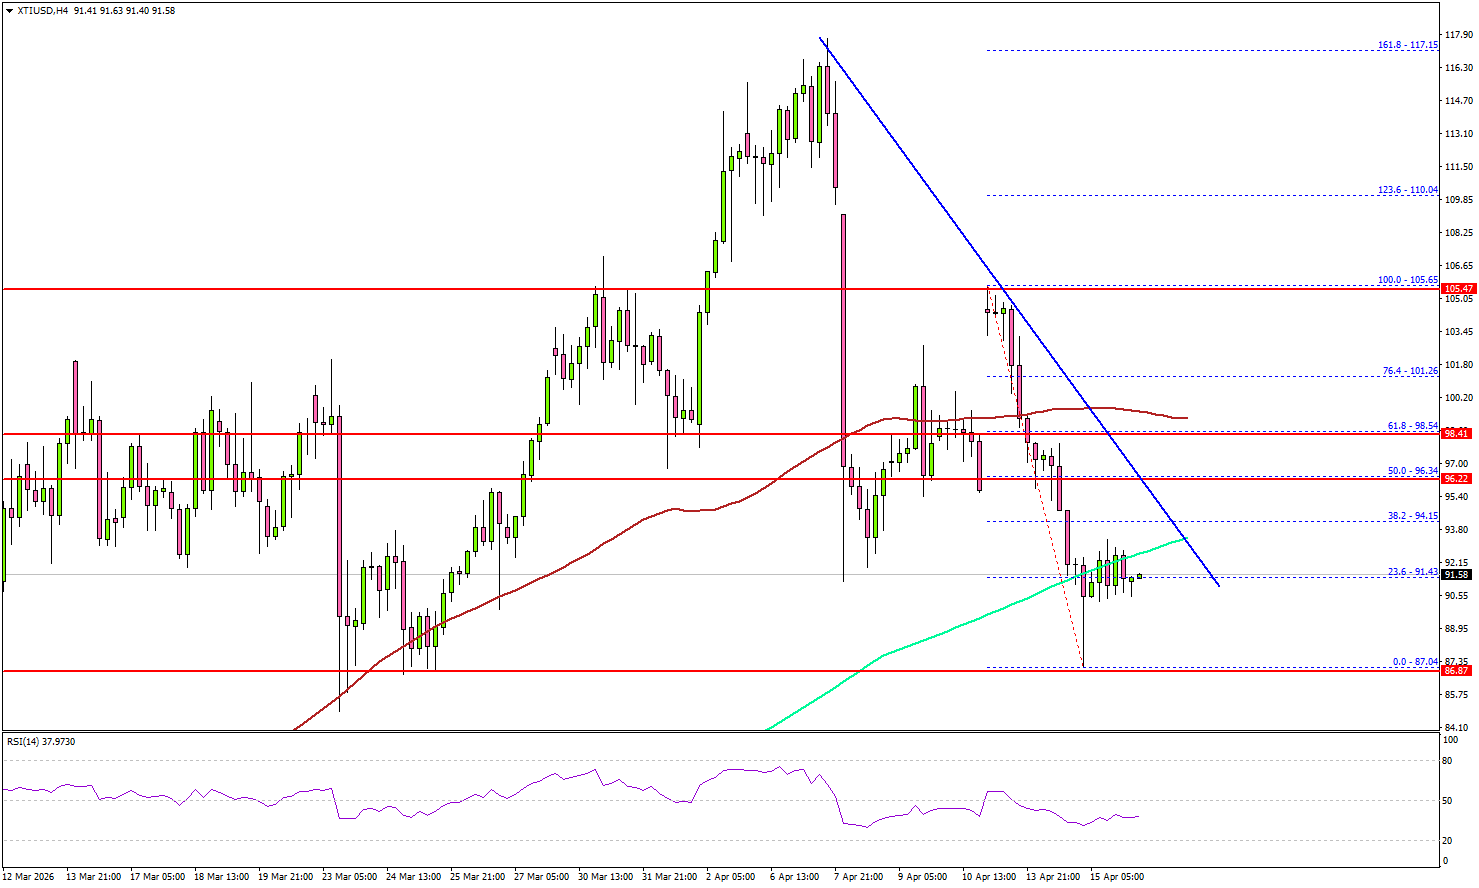
On the upside, immediate resistance is near the $95.00 level. The first major hurdle for the bulls could be $96.00. There is also a major downtrend line forming with resistance at $96.40.
Closing above the $96.40 level may send oil prices towards the $100 level. Any further gains may require a test of $105 in the near term. On the downside, the first major support is near the $88 area. The next support level could be $85.50, below which the price could fall and test $83.20.
A daily close below $83.20 could open the doors to a bigger decline. In the mentioned case, the bears might aim for a drop towards the $80.00 level.
Looking at gold, there has been a nice increase, but the bulls need to push the price above $4,950 for the uptrend to continue.
Economic releases to watch today
- US Initial Jobless Claims – Expected 215K, vs. 219K previously.
- US industrial production for March 2026 (monthly) – 0.1% expected, vs. 0.2% previously.


